Labour force participation
|
|
|
- Gwenda Rose
- 5 years ago
- Views:
Transcription

1 Fourth Population and Housing Census, Rwanda, 2012 THE REPUBLIC OF RWANDA Thematic Report Labour force participation NATIONAL INSTITUTE OF STATISTICS OF RWANDA i
2 ii
3 THE REPUBLIC OF RWANDA Ministry of Finance and Economic Planning National Institute of Statistics of Rwanda Fourth Population and Housing Census, Rwanda, 2012 Thematic Report Labour force participation January 2014 iii
4 The Fourth Rwanda Population and Housing Census (2012 RPHC) was implemented by the National Institute of Statistics of Rwanda (NISR). Field work was conducted from August 16 th to 30 th, The funding for the RPHC was provided by the Government of Rwanda, World Bank (WB), the UKAID (Former DFID), European Union (EU), One UN, United Nations Population Fund (UNFPA), United Nations Development Programme (UNDP), United Nations Children's Fund (UNICEF) and UN Women. Additional information about the 2012 RPHC may be obtained from the NISR: P.O. Box 6139, Kigali, Rwanda; Telephone: (250) Website: Recommended citation: National Institute of Statistics of Rwanda (NISR), Ministry of Finance and Economic Planning (MINECOFIN) [Rwanda], Rwanda Fourth Population and Housing Census. Thematic Report: Labour force participation iv
5 Table of contents List of tables List of figures List of abbreviations Foreword Acknowledgements Executive summary vii x xi xiii xv xvii Chapter 1: Overview of the Fourth Rwanda Population and Housing Census Context and justification Legal and institutional frameworks Census phases 2 Chapter 2: Context, objectives and methodology of the analysis Context National economic context National employment policy, strategies and legal framework context Background of Rwanda s labour force Active population Inactive population Objectives Methodology The RPHC4 questionnaire Definition of key indicators Limitations Labour force framework 11 Chapter 3: Size and composition of the working-age population and labour force participation Size and composition of the active and inactive populations Evolution of working-age population and active population from 1978 to Refined activity rate Economic dependency ratio Labour force participation rate, employment to population ratio, and unemployment rate Labour force participation by age group and sex Labour force participation by area of residence and sex Labour force participation and marital status Labour force participation and level of education Labour force participation and highest degree obtained Labour force participation and nationality Labour force participation and disability 29 Chapter 4: Characteristics of the active population Description and evolution of the active population Distribution of the active population by employment status Distribution of the active population by sex Evolution of the active population between 1978 and Employed population Spatial distribution, age sex structure and background characteristics of the currently employed population 33 v
6 4.2.2 Main occupation Employment status Institutional sector of employment Branch of economic activity Unemployed population Size and composition of the unemployed population Spatial distribution of the unemployed population aged 16 and above Age sex structure and background characteristics of the unemployed population 55 Chapter 5: Characteristics of the inactive population Composition and spatial distribution of the inactive population Age sex structure of the inactive population Background characteristics of the inactive population 65 Conclusion 68 References 70 Annex A Census objectives, methodology and data quality assessment 71 A.1 Objectives of the Census 71 A.2 Methodology and Census phases 72 A.2.1 Census mapping 72 A.2.2 Pilot Census 72 A.2.3 Questionnaires and manuals 72 A.2.4 Census publicity and sensitisation campaign 73 A.2.5 Recruitment and training of field staff 73 A.2.6 Actual Census enumeration 74 A.2.7 Post-enumeration activities 75 A.3 Data quality assessment 75 Annex B Census questionnaire 77 B.1 Private households: person record 78 B.2 Private households: household record and mortality record 82 B.3 Institutional households: person record 83 Annex C Glossary of key terms and definitions 86 C.1 Population and demographic characteristics 86 C.2 Housing and household characteristics 88 C.3 Migration and spatial mobility 89 C.4 Education 90 C.5 Employment/economic activity 91 C.6 Socio-cultural characteristics 93 Annex D Supplementary tables 94 Annex E Sector-level tables 121 vi
7 List of tables Table 1: Distribution of the resident population aged 5 and above by economic activity status, sex and province Table 2: Distribution of the resident population aged 16 and above by economic activity status, sex and province Table 3: Share of the working-age population in the total population by sex and Province.. 15 Table 4: Refined activity rate based on the active population aged 16 and above by sex Table 5: LFPR, employment to population ratio and unemployment rate by age group, area of residence and sex Table 6: LFPR, employment to population ratio and unemployment rate by province, area of residence and sex Table 7: LFPR, employment to population ratio and unemployment rate by current marital status, area of residence and sex (aged 16 and above) Table 8: LFPR, employment to population ratio, employment rate and unemployment rate by level of education, area of residence and sex (aged 16 and above) Table 9: Unemployment rate by the highest level of education and area of residence Table 10: LFPR, employment to population ratio, and unemployment rate by highest degree obtained, area of residence and sex (aged 16 and above) Table 11: LFPR, employment to population ratio, employment rate and unemployment rate by nationality, area of residence and sex Table 12: LFPR, employment to population ratio, employment rate and unemployment rate by disability status, area of residence and sex (aged 16 and above) Table 13: Distribution (number and percentage) of the currently employed population aged 16 and above by area of residence, province and sex Table 14: Distribution (number and percentage) of the currently employed population aged 16 and above by level of education and sex Table 15: Distribution (number and percentage) of the currently employed population aged 16 Table 16: and above by highest degree obtained and sex Distribution (number) of the currently employed population aged 16 and above by sex, area of residence and nationality Table 17: Distribution (number and percentage) of the currently employed population aged 16 and above by sex, area of residence and disability status Table 18: Distribution (number and percentage) of the currently employed population aged 16 and above by language(s) of literacy and sex Table 19: Distribution (numbers and percentages) of the currently employed population aged 16 and above by main occupation and sex Table 20: Distribution (%) of the employed population aged 16 and above by occupation and level of education Table 21: Distribution (%) of the employed population aged 16 and above by occupation and employment status Table 22: Distribution (%) of the employed population aged 16 and above by occupation, institutional sector and sex Table 23: Distribution (number and percentage) of the currently employed population aged 16 and above by institutional sector of employment, sex and area of residence Table 24: Distribution (number and percentage) of employed population involved in economic activities other than agriculture by industry and sex Table 25: Evolution of the economic activity sectors among the population aged 16 and above from 2002 to Table 26: Age distribution of the unemployed population aged 16 and above Table 27: Table 28: Table 29: Distribution (%) of unemployed population by age group, unemployment status and school attendance status Distribution of the unemployed population aged 16 and above by the highest level of education, unemployment status and area of residence Distribution of the unemployed population aged 16 and above by the highest degree obtained vii
8 Table 30: Distribution (count) of the unemployed population aged 16 and above by nationality Table 31: Distribution (count and percentage) of the unemployed population aged 16 above by disability status and area of residence Table 32: Distribution of the inactive population aged 16 and above by inactivity status Table 33: Distribution (number and percentage) of the inactive population aged 16 and above by area of residence and province, disaggregated by sex Table 34: Mean and median age of the inactive population aged 16 and above bysex, province and area of residence Table 35: Distribution (number and percentage) of the inactive population aged 16 and above by level of education, area of residence and sex Table 36: Distribution (number) of the inactive population aged 16 and above by nationality, area of residence and sex Table 37: Distribution (number and percentage) of the inactive population aged 16 and above by disability status and sex Table 38: Labour force participation rate, employment to population ratio, employment rate and unemployment rate by age-group, area of residence and sex (16 years and above) Table 39: Labour force participation rate, employment to population ratio, employment rate and unemployment rate by level of education, area of residence and sex (16 years and above) Table 40: Labour force participation rate, employment to population ratio, employment rate and unemployment rate by age-group, sex and area of residence Table 41: Age-sex distribution (count and %) of the currently employed population aged 16 years and above (urban) Table 42: Age-sex distribution (count and %) of the currently employed population aged 16 years and above (rural) Table 43: Labour force participation rate, employment to population ratio, employment rate and unemployment rate by nationality, area of residence and sex (16 years and above) Table 44: Distribution (count and %) of the currently employed population aged 16 years and above by level of education by sex and area of residence Table 45: Distribution (count and %) of the currently employed population aged 16 years and above by language(s) of literacy by sex and area of residence Table 46: Distribution (count and %) of the currently employed population aged 16 years and above by main occupation by sex and Area of residence Table 47: Distribution of employed population aged 16 years and above (count) by occupation, status in employment, status in employment and area of residence Table 48: Distribution of employed population aged 16 years and above (count and %) by occupation, institutional sector and sex Table 49: Distribution (count and %) of the currently employed population aged 16 years and above by main Industry by sex and area of residence Table 50: Distribution of employed population aged 16 years and above by economic activity, level of education and sex Table 51: Distribution of employed population aged 16 years and above (count) by economic activity, status in employment and sex Table 52: Age-sex distribution (count and %) of the unemployed population aged 16 years and above (national) Table 53: Age-sex distribution (count and %) of the unemployed population aged 16 years and above (urban) Table 54: Age-sex distribution (count and %) of the unemployed population aged 16 years and above (rural) Table 55: Distribution (count and %) of the unemployed population aged 16 years and above by level of education and area of residence Table 56: Distribution (count and %) of the unemployed population aged 16 years and above by highest degree obtained by sex and area of residence viii
9 Table 57: Table 58: Table 59: Table 60: Table 61: Composition of the inactive population aged 16 years and above (%)bysex and province Age-sex distribution (count and %) of the inactive population aged 16 years and above (national) Age-sex distribution (count and %) of the inactive population aged 16 years and above (urban) Age-sex distribution (count and %) of the inactive population aged 16 years and above (rural) Count of the resident population aged 16 years and above by economic activity status, sex and sector of residence ix
10 List of figures Figure 1: Evolution of Rwanda s GDP per capita, Figure 2: Distribution of working-age population (16 +) by activity status Figure 3: Evolution of working-age population and active population from 1978 to Figure 4: Evolution of the refined activity rate, Figure 5: Economic dependency ratio by province Figure 6: Evolution of economic dependency ratio from 1978 to Figure 7: Economic dependency ratio by sector Figure 8: LFPR by age group and sex Figure 9: Unemployment rate by the highest level of education and sex Figure 10: Evolution of labour force participation rate from 1978 to Figure 11: Composition of the active population Figure 12: Distribution of the active population by sex and province Figure 13: Evolution of the active population aged 16 and above, Figure 14: Age sex distribution (%) of the currently employed population (Rwanda) Figure 15: Mean and median age of the employed population aged 16 and above Figure 16: Occupational segregation index by area of residence Figure 17: Evolution of agricultural and non-agricultural occupations, Figure 18: Occupational segregation index by highest level of educational attendance Figure 20: Distribution of the employed population aged 16 and above by institutional sector and occupation Figure 20: Distribution of the currently employed population aged 16 and above by employment status and sex Figure 21: Distribution of the employed population aged 16 and above by employment status, area of residence and sex Figure 22: Distribution of the currently employed population aged 16 and above by main activity sector in 2002 and Figure 23: Distribution of the currently employed population aged 16 and above by the predominant branches of economic activities and areas of residence Figure 24: Distribution of the unemployed population aged 16 and above by unemployment status Figure 25: Distribution of the unemployed population aged 16 and above by sex Figure 26: Distribution of the unemployed population aged 16 and above by province and unemployment status Figure 27: Distribution of the unemployed population aged 16 and above by area of residence Figure 28: Distribution of unemployed population by unemployment status, sex and area of residence Figure 29: Age sex distribution of the unemployed population aged 16 and above Figure 30: Distribution of the unemployed population aged 16 and above by age group and area of residence Figure 31: Distribution of the unemployed population by sex and highest level of education attained Figure 32: Distribution of the inactive population aged 16 and above by sex Figure 33: Age sex distribution of the inactive population aged 16 and above x
11 List of abbreviations CE/FM CTC DRC EDPRS EICV EMA/ENTA GDP HH ICPD-PoA ILO IPAR ISIC LFPR MDGs MINAFFET MINALOC MINECOFIN MINEDUC MTN NCC NEPAD NISR PES PRSP RPHC4 UN USD Certificat d études familiales Census Technical Committee Democratic Republic of the Congo Economic Development and Poverty Reduction Strategy Enquête Intégrale sur les Conditions de Vie des ménages (Household Living Conditions Survey) Ecole des Moniteurs Auxiliaire/Ecole Normale Technique Auxiliaire Gross Domestic Product Household International Conference on Population and Development Programme of Action International Labour Organization Institute of Policy Analysis and Research International Standard Industrial Classification of all economic activities Labour Force Participation Rate Millennium Development Goals Ministry of Foreign Affairs Ministry of Local Government Ministry of Finance and Economic Planning Ministry of Education Mobile Telecommunication Network National Census Commission New Partnership for Africa s Development National Institute of Statistics of Rwanda Post-Enumeration Survey Poverty Reduction Strategy Paper Fourth Rwandan Population and Housing Census United Nations United States Dollar xi
12 xii
13 xiii
14 xiv
15 xv
16 xvi
17 Executive summary The Fourth Rwanda Population and Housing Census (RPHC4) enumerated a resident population of 10,515,973 people of which 107,822 were living in institutional households and 10,378,021 living in private households. Only the latter were eligible for the questions on economic activity. The official minimum working age in Rwanda is 16 and above. Females were predominant among the working-age population (54%). Of the entire population aged 16 and above 74% were economically active. The economic activity rate was higher in rural areas (75%) compared to urban areas (68%) and it was higher among males (76%) compared to females (72%). There were 4,152,682 employed people, representing 71% of all residents aged 16 and above. Unemployment in Rwanda is an urban phenomenon and affects young people (16-35 years) more than adults. The unemployment rate in urban areas (7.7%) was more than twice as high as the one at the national level (3.4%), whereas it was 2.6% in rural areas. The unemployment rate among active youth (16 35) was 4.0% and 8.7% respectively at the national level and in urban areas, while it was 2.6% and 5.6% among adults (aged 36 65). The breakdown of the unemployment rate by the highest level of education showed that young persons with secondary and university levels of education are most exposed to unemployment. 13% of active persons with an upper secondary education level were unemployed and the unemployment rate was 10% for those who had attended university. The level of education of the labour force is still low. 26% of the employed population have never attended school and 61% have attended only primary school. 47% of the unemployed population had a primary school level of education. The Rwandan labour market is predominated by agriculture (73%).A higher percentage of employed females is employed in agriculture (82%) compared to males (63%) and a higher percentage of employed persons in rural areas is farmers(83%) compared to those in urban areas (21%). Non-agricultural occupations in urban areas were mainly services and sales workers and craft and related trades workers. Except for agricultural and clerical support workers, men predominated in all other occupations. Concerning employment status, the results showed that the majority of the employed population in Rwanda were self-employed in the agriculture sector (60%), followed by employees (18%) while self-employed out of agriculture represented 8% of the total employed population. The proportion of males who were employees was twice as high as the corresponding figure for females, while the proportion of women contributing to family work was more than double that of men. The results show that 94% of the employed population were employed by the private sector and the public sector employed 4%. Non-profit organisations employed only 0.5%.In the public sector, six out of 10 employed persons were males. The analysis of the branches of economic activity reveals that 76% of the employed population were working in the primary sector, 6% in the secondary sector and 16% in the tertiary sector. The fastest growing branches of economic activity between 2002 and 2012 were administration and support services activities (83%), arts, entertainment and recreation (23%), financial and insurance activities (18%) as well as accommodation and food service activities (18%). xvii
18 The inactive population, which consists of persons, aged 16 and above who are out of the labour force, amounted to 1,545,708. The majority were students (51%), for both men and women, followed by persons looking after the home or family (25%). The majority of inactive persons had a primary level of education (60%) and 24% of all inactive persons had attended or were still attending lower secondary school. xviii
19 Chapter 1: Overview of the Fourth Rwanda Population and Housing Census 1.1 Context and justification The history of the Population and Housing Census in Rwanda dates back to the 1970s. To date, four modern censuses have successfully been conducted in Rwanda, in 1978, 1991, 2002 and The 2002 Census collected a number of demographic and socio-economic characteristics and indicated a total population of 8,128,553 people. Following the United Nations Decennial Census Program, the 2012 Census is the Fourth Rwanda Population and Housing Census (RPHC4). It indicates that the country now has a total population of 10,515,973 people. Besides the endorsement of recommendations from major international conferences held under the auspices of the United Nations, the Government of Rwanda (GoR) has been focusing since 2000 on the long-term Vision 2020 that aims at transforming Rwanda into a middle-income country. This is being implemented through the medium-term planning framework of the Economic Development and Poverty Reduction Strategy (EDPRS) for successive five-year periods. The measurement of progress in implementing the EDPRS and the various UN recommendations calls for the availability of demographic and socioeconomic statistical data to inform the selected indicators at different levels. The RPHC4 is a reliable and comprehensive source of data, which compared to other official statistics data sources (administrative data, surveys, etc.) allows for disaggregation to the lowest geographical level. The RPHC4 was undertaken to update the national mapping and demographic databases, to provide indicators for monitoring poverty reduction strategies and achievement of international development goals (MDGs, ICPD-PoA, NEPAD, etc.) and to strengthen the technical capacity of the National Institute of Statistics of Rwanda (NISR). A more detailed discussion of the long- and short-term objectives of the Census is presented in Annex A of this report. 1.2 Legal and institutional frameworks As an essential precondition for Census execution, the legalization of its operations was secured by a Presidential Decree officially establishing and determining the administrative organization of the Census. In addition, a Ministerial Order of the Minister of Finance and Economic Planning has set forth the official and statutory requirements for Census activities. The institutional framework set up for implementing the RPHC4 consists of three main bodies: the National Census Commission (NCC), the Census Technical Committee (CTC) and the decentralized branches of the NCC at province and district levels. In order to ensure focused functioning during the whole period of Census execution, a 1
20 Census Unit was created within the NISR, as an executing unit, and benefiting from other financial, logistical and technical support services from the NISR. 1.3 Census phases Following the preparatory phase of the Census, which consisted of the production of the project documents, schedule and Census budget, the following technical activities were undertaken: Census mapping; A Pilot Census; Questionnaire and manual development; Census publicity and sensitization campaign; Recruitment and training of field staff; Census enumeration; and Post-enumeration activities. Further details on all Census phases can be found in Annex A of this report. The success of the RPHC4 is attributable largely to the rigorous pre-census planning and robust Census enumeration monitoring undertaken by the NISR as well as the remarkable support received from the Government and people of Rwanda and the generous technical and financial assistance given by international development partners. 2
21 Chapter 2: Context, objectives and methodology of the analysis 2.1 Context National economic context Rwanda is a landlocked country situated on the border of Central Africa and East Africa, with a total surface area of 26,338 square km. Bordering Rwanda are Uganda to the north, Tanzania to the east, the Democratic Republic of the Congo (DRC)to the west and Burundi to the south. After the socio-economic crisis of the war and the 1994 genocide against the Tutsi, the GoR adopted a long-term strategic vision known as Vision 2020 which aims to move Rwanda from a very poor country to a middle-income country. Despite the war and the genocide against the Tutsi, with the serious and harmful consequences they had on all sectors of the country, Rwanda s economic growth over the last decades has been remarkable. With a Government that is committed to achieving sustainable economic growth coupled with growth in employment opportunities for its people, Rwanda has made impressive progress in rehabilitating and stabilising its economy to exceed pre-1994 levels. The overall economy is growing at a significant rate. The GDP annual growth rate isan average of 8.2% between 2000 and Rwanda s GDP per capita has increased from less than USD 200 in 1994 to USD 644 in 2012 (Figure 1). Figure 1: Evolution of Rwanda s GDP per capita, Source: National Institute of Statistics of Rwanda. Another sign of Rwanda s economic transformation is that development of the nonagricultural sectors of the economy has clearly begun. So far, this has been dominated by a 3
22 proliferation of small-scale business and activities operating on an informal or semi-informal basis. The magnitude of this phenomenon over the past 10years has been large enough to make non-agricultural entrepreneurship and wage employment a major source of new employment and income opportunities and to have quite a significant impact on the structural pattern and pace of economic growth. According to the 2011 Household Living Conditions Survey (EICV3) results, increases in non-farm wages have been among the major drivers of the poverty rate reduction from 57% in 2005/2006 to 45% in 2010/2011 (IPAR, 2012). This is a substantial reduction of 12% within only a five-year period. The EICV results show that extreme poverty has also been reduced from 40% in 2000/2001 to 36% in 2005/2006 and to 24% in 2010/ National employment policy, strategies and legal framework context Vision 2020 presents the framework and key priorities for Rwanda s development with employment as one of the fundamental pillars. Vision 2020 has been made operational by a series of medium-term national Poverty Reduction and Economic Development Strategies. The first strategy was the Poverty Reduction Strategy Paper (PRSP) finalised in 2001, which covered the period The PRSP evaluation report shows that social life improvements in the education and health sector were achieved; however, the sector dealing with the production of goods and services saw little change. The PRSP was followed by the EDPRSI, which covered the period During its implementation, priority was given to accelerating economic growth, creating employment and generating exports. The evaluation of the EDPRS1showed the achievements, opportunities and challenges, learned lessons, which resulted in the organisation of EDPRS1. The EDPRS1 will cover the period and it is built around four thematic priority areas: economic transformation, rural development, productivity and youth employment and accountable governance. The 2012 Census data on economic activity contained in this report will inform the implementation of the EDPRS2. In line with the national strategies, legal and regulatory frameworks, as well as the international conventions that Rwanda has ratified, the GoR adopted the National Employment Policy in The National Employment Policy places employment promotion at the centre of poverty reduction and sustainable development, and it highlights the following priority areas of intervention: rural sector development, private sector and entrepreneurship development, youth employment promotion, women s employment promotion, employment promotion of vulnerable groups, strengthening of the labour intensive approach in economic and social infrastructure programmes, human resource development and employability, promotion of tripartism and social dialogue, and social security promotion. The Universal Declaration of Human Rights, which Rwanda has also ratified, stipulates that everyone has the right to work, to have free choice of employment, to just and favourable conditions of work, to protection against unemployment. The Rwandan constitution, in Article 37, stipulates that Every person has the right to free choice of employment and that 4
23 Persons with the same competence and ability have a right to equal pay for equal work without discrimination. The Rwanda Labour Law, No. 13 of 27/05/2009, stipulates that: It is prohibited to employ a child in any company, even as apprentice, before the age of sixteen (16).A child aged between sixteen (16) and eighteen (18) may be employed under condition that the rest between two working periods be of a minimum duration of twelve (12) consecutive hours and that the performed job be proportionate to his/her capacity and not be of the nature that can damage his/her health, education and morality. Article 9 of the above mentioned law stipulates that it shall be forbidden to directly or indirectly subject a worker to gender-based violence or moral harassment within the context of work. Its Article 12 relates to the right to equal opportunities and salaries of all workers regardless of their race, colour, origin, sex, marital status, family responsibility, religion, beliefs, political opinions, social or economic condition, disability and previous, current or future pregnancy. 2.2 Background of Rwanda s labour force Active population During the first Census of 1978, the economically active population included all persons aged seven and above who were employed or seeking a job. The results of that Census showed that out of the total population of 4,831,527, the economically active population numbered 2,666,560,representing crude activity rate of 55%. Unlike the 1978 Census, during the 1991Censusthe minimum age of economic activity was fixed at 10 years. The results of that Census revealed that out of the total population of 7,157,551, the active population amounted to 3,569,436 people, corresponding to a crude activity rate of 50%. According to the 2002 Census, the economic activity was measured among the population aged six and above. In that context the active population was evaluated to number 3,418,078 out of the total population of 8,128,553. The crude activity rate was 42%. The Survey conducted in 2000/01 (EICV1) showed that the usual activity rate was estimated to 88% and this fell to 86% in 2005/06 according to EICV2. Between 2005/06 and 2010/11 the population in the labour force has kept pace with the growth of the population aged 16 and above. In fact, the Labour Force Participation Rate (LFPR) recorded by EICV3 results was 85%, which is not statistically different from the figure found in 2005/06. Employed population The 1978 Census enumerated 2,647,875 employed persons of a population aged seven and above of 3,620,059. This represents an employment to population ratio of 73%. This percentage sharply decreased to 56% between 1978 and In fact, the 2002 Census measured the economic activity among the population aged six and above and it found that 3,387,469 of 6,065,433 people were working. This fall may be due to the decrease of 5
24 economic activity among children, which decreased from 28% to 13% between the two censuses. The Rwandan labour supply has been characterised by low levels of education. The results of the first General Population Census conducted in 1978 revealed that 98% of the employed population had only primary-level education or below. The results of the 2002 Census showed that the percentage of the employed population with at least a primary level of education was 93%. According to EICV3, conducted in 2010/11, the level of education among the employed population aged 16 and above was still low; 91% of the employed population had at least primary-level education and only 9%of the employed population had attended secondary school. The economic activity of the majority of Rwandans is based on agriculture. The 1978 Census showed that 93% of the population aged seven and above was employed in agriculture. Services engaged almost 5% of the employed population and the remainder (2%) were engaged in the extractive or manufacturing industries. The 2002 Census as well as EICV3 conducted in 2010/11 revealed that the Rwandan economy is slowly shifting from agriculture to other sectors of economic activity. The percentage of the employed population in agriculture decreased from 87% in 2002 to 73% in 2010/11. The percentage of the employed population in secondary sector activities grew from 3% in 2002 to 6% in 2010/11, while the figure for the tertiary sector increased from 10% in 2002 to 20% in 2010/11. Unemployed population According to the International Labour Organization (ILO), an unemployed person is someone who during the reference period was simultaneously without work, currently available to work and seeking a job. In Rwanda s 2002 Census, all persons aged six and above who reported that they had not worked during the reference period were considered unemployed. The questionnaire of the RPHC4however includes a series of questions which allow unemployment to be defined using the three criteria mentioned above or a more relaxed definition using the first two criteria. In many low income countries that do not have advanced social safety nets, unemployment is quite low because it is rare to be able to afford to do no work at all (EICV3, 2010/11). Different censuses as well as household surveys conducted in Rwanda showed that the unemployed rate in Rwanda is low but increasing over time. In fact, the 1978 General Population Census indicated an unemployment rate of 0.5%, which had increased to 0.9% by According to the EICVs conducted in 2000/01, 2005/06 and 2010/11, the unemployment rate within the seven-day reference period was respectively 1.4%, 1.5% and 2.4%. It is important to mention that EICVs collected data throughout 12-monthperiods and consequently captured the effect of seasonality, while censuses collected data on only 15 days in a particular month, in this case August. The same studies revealed that unemployment in Rwanda is an urban phenomenon and it tends to be higher among younger persons. In the 2002 Census, the unemployment rate in urban areas was almost 10 times as high as the unemployment rate in rural areas (3.9% vs. 6
25 0.4%). The same pattern was observed from EICV3 conducted in 2010/11, where those rates were 8.8% vs. 1.2% respectively in urban and rural areas, and hit 13.1% in the urban area of Kigali City Inactive population In the framework of measuring economic activity, the inactive population or population outside the labour force comprises all persons in the population aged 16 and above who during the short reference period of one week were neither employed nor unemployed (ILO). According to the 1978 Census findings, of the population aged seven and above of 3,620,059, 26% were inactive. Students made up a high percentage of the inactive population (49%). The 2002 Census revealed that the inactive population accounted for 44% of the total population aged six and above. As for the 1978 Census, students comprised majority of the inactive population (60%), followed by homemakers (29%). 2.3 Objectives The specific objectives of this analysis are the following: Analyse the sizes of the different segments of the working-age population (active and inactive populations) and their evolution since 1978; Measure the levels, trends, and spatial variations of indicators of the labour force participation; Describe the active population s characteristics such as age sex structure, spatial distribution and background characteristics; Describe the employed population s characteristics such as age sex structure, spatial distribution and other background characteristics; Describe the unemployed population s characteristics such as age sex structure, spatial distribution and other background characteristics; and Describe the inactive population s characteristics such as age sex structure, spatial distribution and other background characteristics. 2.4 Methodology The RPHC4 questionnaire People s economic activity is among the most important topics of investigation in a Population Census. To measure the economic activities in the RPHC4, among other questions related to other specific topics, 10 questions related to economic activity and labour force participation have been asked of all household members aged at least five. The first question (P20) was about whether a person has performed any economic activity during the seven days before the Census night. The second question (P21), asking why a person has not worked during the reference period (seven days), was addressed to those who answered No to the first question. The third question (P22) applied to those who responded that the reason they have not worked during the reference period is that they did 7
26 not have a job or were contributing family workers. Those persons were asked whether they had performed at least one of activities specified in the given list. The next question (P23) asked if those without jobs, according to the first three questions, were available to start work. The following question (P24) asked whether a person who reported being available in P23 had been looking for a job during the seven days before the Census night. Questions P25 to P28 were asked of those who were employed or those who had ever worked. They covered the following variables: occupation (P25), status in employment (P26), economic activity (P27), and sector of employment (P28) (see Annex B). 8
27 2.4.2 Definition of key indicators The key concepts and indicators used to measure economic activity are found in the glossary in Annex C. The formulas used to calculate specific indicators are given in Box 1. Box 1: Key formulas used to calculate economic activity indicators Labour force participation rate = Employment rate: The employment rate measures the level of employment in the labour force of a country. It shows the percentage of the labour force that is employed (ILO). Employment rate = Unemployment rate: The unemployment rate is a measure of imbalance in the labour market. It shows the percentage of the labour force without work (ILO). Unemployment rate = Inactivity rate: The inactivity rate is the proportion of the working-age population that is not in the labour force. By definition, the inactivity rate and the LFPR will add up to 100% (ILO). Employment to population ratio: The employment to population ratio measures the performance of the economy in providing employment to its growing population (ILO). Employment to population ratio = Occupational sex segregation index: The occupational sex segregation index is one of the ILO decent work indicators. It is a commonly used proxy indicator for equality of opportunity in employment and occupation. The index measures the extent to which labour markets separate male and female occupations. This index is given by the following formula: Where nai and nbi are, respectively, the number of men and women in occupational category i and na and nb are, respectively, the total number of men and women in all occupational categories. The value of the segregation index D ranges from 0 to1, 0 indicating no segregation and 1 indicating complete segregation. The index may be interpreted as the fraction of persons who need to change occupations to achieve zero segregation (Labour force data analysis: guidelines with African specificities). Economic dependency ratio is an indicator which gives the numbers of persons unemployed and inactive per 100 employed persons. Economic dependency ratio = 100 X Refined activity rate 9
28 2.4.3 Limitations In general the measurement of economic activity through the general population census is limited to a few indicators. The RPHC4 like other population censuses has not captured some employment characteristics such as working hours, income from work and informal employment. Consequently, some important indicators such as the underemployment rate (which shows the insufficiency of the volume of work among the employed population) could not be computed. It is also worth noting that the information presented in this report is limited to the main activity performed during the reference period (seven days before the Census night)while the working population of Rwanda routinely works in multiple jobs. The questionnaire has captured information that can be used to measure the unemployed population using either a strict definition or a relaxed definition. However, using the strict definition will tend to underestimate the unemployment rate because the reference period for seeking a job was shortened to seven days before the Census night. In the context of Rwanda, there may be many reasons why persons who have searched for a job one month before the given reference period have not done so during the reference period. Consequently, the relaxed definition which is used in this report excludes the condition of whether or not a person was seeking a job during the reference period of seven days before the Census night. Thus a person will be considered unemployed if he/she did not have any job during the reference period and was available to work (irrespective of whether that person was seeking work or not). 10
29 2.4.4 Labour force framework TOTAL POPULATION: 10,515,973 POPULATION LIVING IN INSTITUTIONAL HH: 137,952 POPULATION LIVING IN PRIVATEHH:10,378,021 POPULATION AGED16+: 5,846,266 POPULATION BELOW 16:4,531,755 WORKED IN 7DAYS NOT WORKED TEMPORARILY ABSENT FROM JOB DID NOT HAVE JOB/ENTERPRISE AVAILABLE TOWORK NOT AVAILABLE TOWORK EMPLOYED: 4,152,682 UNEMPLOYED: 147,876 INACTIVE: 1,545,708 LABOUR FORCE: 4,300,558 11
30 Chapter 3: Size and composition of the working-age population and labour force participation The population constitutes the human capital of the nation and determines its potential labour supply. On the one hand, the working population is a factor of production and its capacity in terms of skill level and aptitude contributes to the productivity of the economy of the country. On the other hand, the population is made up of social groups of particular concern and meeting their needs is a major challenge faced by decision-makers, public and private institutions and society itself. 1 The objective of this chapter is to present the size and composition of the population in terms of economic activity status, its evolution from 1978, and the level of labour force participation. The RHPC4 conducted in August 2012 enumerated 10,515,973 resident persons, of whom137,952 were living in institutional households and 10,378,021 in private households. Questions related to economic activity were addressed to all residents living in private households aged at least five while those living in institutional households during the Census or those younger than five years were not asked these specific questions. Persons residing in institutional households are therefore excluded in the below analysis. 3.1 Size and composition of the active and inactive populations During the seven days (reference period) prior to the 2012 Census night, all persons aged five and above who had performed any economic activity or who were temporarily absent from their job were classified as employed, while those who were not working and available to work were classified as unemployed. Those two categories form the active population while the inactive population refers to those aged five years and above who were at the same time not working and not available to work. Table 1below shows the counts of active and inactive persons among the population aged five and above by province and sex. 1 African Development Bank (2012), p

31 Table 1: Distribution of the resident population aged 5 and above by economic activity status, sex and province Status and sex Province Rwanda Kigali City Southern Western Northern Eastern Rwanda Male 4,200, ,575 1,018, , ,817 1,035,617 Female 4,646, ,701 1,161,003 1,105, ,781 1,127,417 Total 8,846, ,276 2,179,036 2,066,028 1,479,598 2,163,034 Active Male 2,098, , , , , ,262 Female 2,289, , , , , ,443 Total 4,388, ,114 1,047, , ,856 1,077,705 Inactive Male 2,101, , , , , ,355 Female 2,356, , , , , ,974 Total 4,458, ,162 1,131,791 1,066, ,742 1,085,329 Even though the economic activity was measured from the age of five, the results presented in this report are mainly produced based on the population aged at least 16, the official working age in Rwanda. The economic activity characteristics of the population aged below 16 were analysed in a specific thematic report on Socio-economic characteristics of children. According to the results presented in Figure 2, the share of employed population in the working-age population (16 +) was 71% while the proportion of students was 13%. Details on the active population (employed + unemployed) are found in Chapter 4, whereas the detail description of inactive population (students, retired, old age, looking after family) are discussed in in Chapter 5. Figure 2: Distribution of working-age population (16 +) by activity status Table 2 shows the count of the active and inactive population aged 16 and above by sex and province. The RPHC4 counted 4,300,558 active and 1,545,708 inactive persons, summing 13
32 up to a total working-age population of 5,846,266. Females were predominant among the working-age population as well as among the active and inactive populations. Table 2: Distribution of the resident population aged 16 and above by economic activity status, sex and province Status and sex Province Rwanda Kigali City Southern Western Northern Eastern Rwanda Male 2,716, , , , , ,086 Female 3,129, , , , , ,476 Total 5,846, ,864 1,438,382 1,330, ,848 1,403,562 Active Male 2,055, , , , , ,015 Female 2,245, , , , , ,765 Total 4,300, ,534 1,029, , ,791 1,055,780 Inactive Male 661,579 86, , ,912 93, ,071 Female 884, , , , , ,711 Total 1,545, , , , , ,782 The results presented in Table 2 also show that the Southern Province was the largest in terms of the working-age population as well as the inactive population, while Kigali City was the smallest in both the working population and active population. It is also worth noting that in all other provinces, except Kigali City, the number of workingage females was higher than the number of working-age males. The percentage of workingage males in Kigali represented 52%. Table 3 shows that Rwanda s population is dominated by the population aged 16 years and above which represented 56% in The comparison with the 2002 Census reveals a rise of 3 percentage points between the two censuses. The share of the working-age population in Kigali city (64%) is higher than in other provinces which range from 55% to 57%. The share of working-age females amongst all females is higher than for males in all provinces, except in Kigali. 14
33 Table 3: Share of the working-age population in the total population by sex and Province Province Total population Working-age population(16+) Share of working-age population Male Female Total Male Female Total Male Female Total Rwanda 4,964,554 5,413,467 10,378,021 2,716,688 3,129,578 5,846, Kigali City 569, ,690 1,114, , , , South 1,202,054 1,345,792 2,547, , ,415 1,438, West 1,146,334 1,292,021 2,438, , ,724 1,330, North 807, ,714 1,708, , , , East 1,238,249 1,330,250 2,568, , ,476 1,403, Evolution of working-age population and active population from 1978 to 2012 Figure 3 shows the evolution of the working-age population (16+) and active population from 1978 to The working age population has increased consistently over time while a slight decrease in the active population can be observed between 1991 and Between 2002 and 2012, however, the increase in the active population had almost the same pace as that in the working-age population (16+). The annual growth of the population aged 16 years and above was 3.0% while the one for the active population was 2.9%. The gap between the working-age population and active population, which represents the inactive population, was broadening with the time. This pattern may be explained by the increasing number of students in secondary schools and universities. The share of students amongst the inactive population rose from 37% in 2002 to 51% in Figure 3: Evolution of working-age population and active population from 1978 to 2012 Source: Rwanda Population and Housing Censuses1978, 1991, 2002 and Notes: (1) The population of the 1991 Population Census as presented in Figure 3 is aged 15 and above instead of 16 and above. 3.3 Refined activity rate The refined activity rate is the labour force aged 16 years and above expressed as a percentage of the total population. As shown in Table 4 below the refined activity rate 15

34 calculated based on the active population aged 16 and above was 41% at the national level and it is almost the same for men and women. Table 4: Refined activity rate based on the active population aged 16 and above by sex Population Male Female Total Total population 4,964,554 5,413,467 10,378,021 Active population aged 16+ 2,055,109 2,245,449 4,300,588 Refined activity rate Figure 4 shows the evolution of the refined activity rate between 1978 and The refined activity rate slightly decreased between 1978 and 1991 and sharply decreased from 46% to 40% between 1991 and As some of those young people, born after 1994, already started to enter the labour market in 2012, they contributed to the increase of the refined activity rate. Figure 4: Evolution of the refined activity rate, Source: Rwanda Population and Housing Censuses1978, 1991, 2002 and Economic dependency ratio The dependency ratio is defined as the number of inactive and unemployed persons for 100 employed persons. To compute it, the inactive persons must also include the persons under the specific age for which the economic activity was measured. The economic dependency ratio calculated based on the employed population aged five and above, was 145 at the national level; this means that 100 employed persons supported 145 inactive and unemployed persons. The Southern Province was the one with the highest economic dependency ratio while the lowest dependency ratio was reported in the Northern Province as shown in Figure 5. 16

35 Figure 5: Economic dependency ratio by province If calculated based only on the employed population aged 16 and above, the economic dependency ratio increases from 145 to 150 at the national level and it fluctuates from 132 in the Northern Province to 157 in the Western Province. The below comparison of the economic dependency ratio across different censuses was based on the employed population aged 16 years and above. Figure 6 shows that there has been a rise of the dependency ratio between 1978 and 2002 while a drop of 3 percentage points was observed between 2002 and That decline may be attributable to the different Government programs aiming the promotion of employment and poverty reduction such as Vision 2020 Umurenge, Hanga Umurimo etc. In addition the Government has implemented measures to encourage national as well as foreign investors to conduct their business in Rwanda. This may also have been the source of new jobs which contributed to the decrease of the dependency ratio between the last two censuses. 17

36 Figure 6: Evolution of economic dependency ratio from 1978 to 2012 Source: Rwanda Population and Housing Censuses 1978, 1991, 2002, Figure 7 below shows the economic dependency ratio by sector. The darkest red colour shows the highest dependency ratio. The highest dependency ratio is concentrated in the different districts of the Southern Province such as Nyamagabe, Nyaruguru and Huye; in the Western Province, high ratios were found in some sectors of Rubavu and Nyabihu Districts. The dependency ratio was also high in different sectors of Bugesera and Nyagatare Districts in the Eastern Province as well as in some sectors of Nyarugenge, Gasabo, Kicukiro and Rulindo districts. Details on the number of employed, unemployed and inactive populations by sex and administrative sector are presented in Table 61 in Annex E. 18

37 Figure 7: Economic dependency ratio by sector 3.5 Labour force participation rate, employment to population ratio, and unemployment rate The data collected during the RPHC4 allowed the computation of important indicators related to economic activity. In the present section the analysis is focused on the following indicators: labour force participation rate (LFPR), employment to population ratio and unemployment rate. The definition of each of these indicators is presented in Annex C. The information in the tables, graphs and maps in this section is computed based on the population aged at least 16, the legal minimum age for economic activity in Rwanda. All indicators mentioned above were analysed in respect of social demographic characteristics as well as spatial distribution Labour force participation by age group and sex The LFPR reflects the extent to which a country s working-age population is economically active while the employment to population ratio shows the proportion of the working-age population that is employed. Table 5 below shows an LFPR of 74% at the national level, while the employment to population ratio was 71%. 19
38 The LFPR and employment to population ratio were the highest among the adult population (aged 36 65) and lowest among the oldest population (65+ years old). The high rates among elderly persons, especially in rural areas, indicate the characteristics of an agriculture based economy where everybody is obliged to work in order to survive, and that the populations in rural areas stay in the labour market longer than those living in urban areas. The levels of both indicators were higher in the rural areas (75% and 72%) compared to urban areas (68% and 54%). The low rates in urban areas may be attributed to the high level of school attendance among the working-age population. The unemployment rate is the proportion of the labour force that is unemployed. Unemployed persons are defined in this analysis as those who, during the seven days before the Census night, were without work and at the same time available to work. This constitutes the more relaxed definition of unemployment, which disregards the condition of seeking work over a specific reference period. The results in Table 5 reveal that, unemployment rate in Rwanda were 3.4% in The unemployment rate is an urban phenomenon and it is severe among the youth population. It was 7.7% in urban areas, more than twice as high as the national unemployment rate and three times as high as the level in rural areas (2.6%). The unemployment rate among females was more than double that of males in urban areas countrywide. Concerning the unemployment rate according to age groups, 8.7% of the age group in urban areas were unemployed and unemployment rate was higher among females belonging to the same age group (12.7%). 20
39 Table 5: LFPR, employment to population ratio and unemployment rate by age group, area of residence and sex Labour force participation Employment to population Age group and rate ratio Unemployment rate area of residence Male Female Both Sexes Male Female Both Sexes Male Female Both Sexes Rwanda Total Urban Total Rural Total Notes: (1) The LFPR is defined as the ratio of the labour force to the working-age population (active + inactive) expressed in percentage terms (ILO). The LFPR is calculated for the population aged 16 and above. (2)Employment to population ratio =.(3) The unemployment rate is defined as the ratio of unemployed to the labour force, expressed in percentage terms. The unemployment rate is calculated for the population aged 16 and above. Figure 8 below shows the labour force participation rate by age-group and sex. The labour force participation rate curve shows that the age at which most young people are in the labour force is between 20 and 24, while the age at which most old people are out of the labour force is between 70 and 74 for females and between 75 and 79 for males. It also shows that for both sexes, the LFPR was low (36%) in the lower age group (16 19) as some young people are still at school. It increased with age and reached a peak in the age groups. Almost 90% of the population stays in the labour force between the ages of 30 and 49 years. At the age 50, a noticeable decline starts and the LFPR becomes lower than 70% at the age 65 as parts of the population get older and retire. Forth lower age groups there is no difference between the LFPR for males and females. The discrepancy begins at age 25, with a higher proportion of males, and this trend continues across all further age groups. The magnitude of disparities is 6.5 percentage points on average. 21
40 Figure 8: LFPR by age group and sex Labour force participation by area of residence and sex The results presented in Table 6 below reveal that the LFPR and employment to population ratio were the highest in the Northern Province (78% and 77%). The lowest levels of both indicators were observed in Kigali City. The levels of both the LFPR and employment to population ratio were higher among males compared to females across all provinces. However, gender disparities were more marked in urban areas compared to rural areas. Among all provinces, Kigali City was the one with the highest gender disparity in both indicators, with figure for males being 17 and 21 percentage points higher, respectively, for the LFPR and employment to population ratio. The difference between Kigali City and other provinces in the unemployment rate is remarkable. While the unemployment rate in Kigali City was 9%, in other provinces it fluctuated between 2% in the Northern Province and 3% in the Southern Province. As at the national level, the unemployment rate was higher in urban areas compared to rural areas in all provinces. The unemployment rate was higher among females than among males in all provinces regardless of the area of residence. 22
41 Table 6: LFPR, employment to population ratio and unemployment rate by province, area of residence and sex Province and area of residence Labour force participation rate Employment to pop ratio Unemployment rate Femal Femal Femal Male e Total Male e Total Male e Total Active population aged 16+ Rwanda Urban ,410 Rural ,589,148 Total ,300,558 Kigali City Urban ,155 Rural ,379 Total ,534 Southern Province Urban ,728 Rural ,527 Total ,029,255 Western Province Urban ,920 Rural ,278 Total ,198 Northern Province Urban ,565 Rural ,226 Total ,791 Eastern Province Urban ,042 Rural ,738 Total ,055,780 Notes: (1) The LFPR is defined as the ratio of the labour force to the working-age population (active + inactive) expressed in percentage terms (ILO). The LFPR is calculated for the population aged 16 and above. (2) Employment to population ratio =.(3) The unemployment rate is defined as the ratio of unemployed to the labour force, expressed in percentage terms. The unemployment rate is calculated for the population aged 16 and above Labour force participation and marital status Table 7 below presents the LFPR, the employment to population ratio and unemployment rate by sex and marital status. The LFPR and the employment to population ratio were highest among married people (87% and 84% respectively) and they were lowest among the never married, possibly because they were young and still in education (55% and 53% respectively). The same pattern is observed in urban areas as well as in rural areas. Except for never married people, where the LFPR in urban areas was slightly higher than the one in rural areas, for other statuses the rates were higher in rural areas compared to urban areas. While the highest LFPR was observed among married males, for females the highest rate was observed among those separated from their husbands. The highest unemployment rate was observed among the never married population as youths form the majority of this population. That rate was 5% at the national level and it reached 9% in the urban areas. It is also important to note that the unemployment rate for 23
42 those separated from their spouses reached 9% in urban areas. Some differences related to gender were observed among the married population and these were more significant in urban areas. Table 7: LFPR, employment to population ratio and unemployment rate by current marital status, area of residence and sex (aged 16 and above) Area of residence and marital status Labour force participation rate Employment to population ratio Unemployment rate Male Female Total Male Female Total Male Female Total Active populatio n aged 16+ Rwanda Never married ,174,348 Married ,714,811 Separated ,513 Widowed ,949 Divorced ,538 Not stated ,399 Total ,300,558 Urban Never married ,491 Married ,426 Separated ,294 Widowed ,798 Divorced ,038 Not started Total ,410 Rural Never married ,857 Married ,334,385 Separated ,219 Widowed ,151 Not stated ,500 Divorced ,036 Total ,589, Labour force participation and level of education Table 8 below shows the LFPR, the employment to population ratio of the working-age population by the highest level of education, and area of residence and sex. The LFPR and the employment to population ratio were higher among the population with no education or a low level of education compared to the figures for those who had at least secondary level education. In fact, the LFPR was higher than 70% for the population with no education or whose studies had not reached secondary education while it was 64% for those who had attended university, 54% for those with upper secondary level education and 34% for those with lower secondary level education. The low level of LFPR and employment to population ratio among the population with a high level of education may have been caused by students who were still attending schools, and were therefore economically inactive. In urban as well as rural areas the same situation appears; however, lower rates were observed among the educated population living in rural areas compared to those in the same category living in urban areas. 24
43 Table 8: LFPR, employment to population ratio, employment rate and unemployment rate by level of education, area of residence and sex (aged 16 and above) Labor force participation rate Employment to population ratio Active population Area of residence and level of education Male Female Total Male Female Total aged 16+ Rwanda No education ,083,900 Pre-primary ,469 Primary ,613,288 Post-primary ,241 Lower secondary ,920 Upper secondary ,198 University ,996 Not stated ,546 Total ,300,558 Urban No education ,705 Pre-primary ,781 Primary ,335 Post-primary ,632 Lower secondary ,772 Upper secondary ,794 University ,678 Not stated ,713 Total ,410 Rural No education ,010,195 Pre-primary ,688 Primary ,258,953 Post-primary ,609 Lower secondary ,148 Upper secondary ,404 University ,318 Not stated ,833 Total ,589,148 The analysis of unemployment by the highest level of education as presented in Table 9 reveals that the highest unemployment rates were found among those with at least upper secondary school-level of education (12%). There was a significant difference in the unemployment rate by level of education across the areas of residence. While the unemployment rate for the population with at least upper secondary education in urban areas was 13%, the corresponding rate in rural areas was 11%. For those who had attended up to lower secondary school, the figure was 6% in urban and 2% in rural areas 25
44 Table 9: Unemployment rate by the highest level of education and area of residence Area of residence and level of education Employed Unemployed Labour force Unemployment rate Rwanda No education 1,057,967 25,933 1,083, Lower secondary and below 2,794,963 82,955 2,877, Upper secondary and university 272,621 37, , Not stated ,415 28, Total 4,152, ,876 4,300, Urban No education 70,376 3,329 73, Lower secondary and below 415,860 26, , Upper secondary and university 163,855 24, , Not stated , Total 656,317 55, , Rural No education 987,591 22,604 1,010, Lower secondary and below 2,379,103 56,295 2,435, Upper secondary and university 108,766 12, , Not stated , Total 3,496,365 92,783 3,589, Across all levels of education, women have less success in accessing jobs than men. The unemployment rate among females was higher than the unemployment rate among males. The greatest disparities among males and females were observed at the upper secondary and university levels. The differences in these education categories were 7 and 6 percentage points, respectively (Figure 9). It is worth noting that in urban areas, the unemployment rate among females reached 21% for the upper secondary level and 15% for the university level. Figure 9: Unemployment rate by the highest level of education and sex Labour force participation and highest degree obtained Table 10 presents the LFPR, employment to population ratio and unemployment rate in respect of the highest degree obtained, area of residence and sex. The results show that 26
45 according to the RHPC4 more than 90% of the population with at least a Bachelor s degree were active. Low LFPR levels were found among the holders of Bacc/diplomas (two or three years of university) and A2/D6/D7, whose rates were respectively 59% and 68%. These low rates indicate that a significant number of these persons may still be at school. At the national level, the employment to population ratio was the highest among PhD holders (91%) as well as in urban areas (92%); in the rural areas, the highest employment to population ratio was found among Bachelor s degree holders. The lowest employment to population ratios were observed among Bacc/Diploma holders in both urban (55%) and rural (50%) areas as well as at the national level (53%). At the national level and in urban areas, the employment to population ratio was higher for males compared to females for all categories of the highest degree obtained, and the differences were more accentuated in urban areas among the population with an A2 certificate or less. The highest unemployment rates were observed among the holders of A2/D6/D7 at the national level (14%) and in both urban (16%) and rural (12%) areas. It is worth noting that the unemployment rates for Bacc/diploma and Bachelor s degree holders were higher than 10% at the national level and in urban areas. In general the unemployment rate was higher among females compared to males with striking differences among A2/D6/D7 holders living in urban areas, where the unemployment rate for females (21%) was almost twice as high as the unemployment rate for males (11%). Table 10: LFPR, employment to population ratio, and unemployment rate by highest degree obtained, area of residence and sex (aged 16 and above) Area of residence and highest degree obtained Labor force participation rate Male Female Both Sexes Male Employment to population ratio Female Both Sexes Male Unemployment rate Female Both Sexes Active population aged 16+ Rwanda None ,986,174 CE/FM ,048 EMA/ENTA ,491 A3/D4/D ,290 A2/D6/D ,539 Bacc/Diploma ,936 Bachelor s ,152 Master s ,600 PhD ,276 Not stated ,052 Total ,300,558 Urban None ,850 CE/FM ,524 EMA/ENTA A3/D4/D ,574 A2/D6/D ,011 Bacc/Diploma ,599 Bachelor s ,587 Master s ,273 PhD ,204 Not stated Total ,410 Rural None ,456,324 CE/FM ,524 27
46 Area of residence and highest degree obtained Labor force participation rate Male Female Both Sexes Male Employment to population ratio Female Both Sexes Male Unemployment rate Female Both Sexes Active population aged 16+ EMA/ENTA A3/D4/D ,716 A2/D6/D ,528 Bacc/Diploma ,337 Bachelor s ,565 Master s PhD Not stated Total ,589, Labour force participation and nationality Table 11shows the LFPR, employment to population ratio, and unemployment rate of the population aged 16 and above by nationality, area of residence and sex. Resident foreigners represented only 0.8% of the total resident population. The findings showed that the highest LFPRs for foreigners were found among Kenyans (90%), persons from the Americas (89%), Burundians (87%) and Ugandans (86%). The Employment to population ratio for males was higher than the one for females, especially among foreigners. The results showed that 86% of Americans who were living in Rwanda during the Census were working, while for the population from East African Community countries other than Rwanda, 85% of Kenyans, 85% of Burundians, 83% of Ugandans and 67% of Tanzanians were employed. As for unemployment, the highest unemployment rate was reported among those with DRC nationality (10%); however, it is important to note that many DR Congolese resided in refugee camps and were therefore administered the Census questionnaire for institutional households, which did not include questions on economic activity. The next highest unemployment rates among foreigners were found among Tanzanians (6%) and nationals of other African countries other than East African Community countries and the DRC (6%). For all nationalities the unemployment rate was higher among females compared to males. 28
47 Table 11: LFPR, employment to population ratio, employment rate and unemployment rate by nationality, area of residence and sex Area of residence and nationality Labour force participation rate Male Female Both Sexes Employment to population ratio Male Female Both Sexes Unemployment rate Male Female Both Sexes Active population aged 16+ Rwanda only ,266,744 Rwanda and other ,552 Burundi ,837 Tanzania Kenya ,044 Uganda ,748 DRC ,019 Other African country Europe Americas Asia ,228 Oceania Not stated ,328 Total ,300, Labour force participation and disability Table 12 shows the LFPR, employment to population ratio and unemployment rate by disability status, area of residence and sex. As expected, the LFPR and employment to population ratio were higher among the population without disability compared to the population with disability. The disparity between women and men was much higher among persons with disabilities. In fact, for persons without disabilities the LFPR was 77% for males and 73% for females, while it was 60% and 52% respectively for males and females with disabilities. The unemployment rates as presented in Table 12 reveal that the difference between active persons with disabilities and those without disabilities in terms of job opportunities is small. Regardless of the disability status the unemployment rate is higher in urban areas compared to rural areas and women living in urban areas are much more exposed to unemployment regardless of their disability status. 29
48 Table 12: LFPR, employment to population ratio, employment rate and unemployment rate by disability status, area of residence and sex (aged 16 and above) Area of residence and disability status Rwanda With disabilities Without disabilities Labor force participation rate Male Female Both Sexes Employment to population ratio Male Female Both Sexes Unemployment rate Male Female Both Sexes Active population aged , ,089,941 Total ,300,558 Urban With disabilities ,542 Without disabilities ,868 Total ,410 Rural With disabilities ,075 Without disabilities ,399,073 Total ,589,148 Figure 10 below shows the evolution of the LFPR from 1978 to Between 2002 and 2012 the working age population grew at almost the same pace as the active population, which was not the case before The LFPR decreased by 5 percentage points between 1978 and 1991 and 14 percentage points between 1991 and 2002, while the decline between 2002 and 2012 was small (1 percentage point). Figure 10: Evolution of labour force participation rate from 1978 to 2012 Source: Rwanda Population and Housing Censuses 1978, 1991, 2002, and
49 Chapter 4: Characteristics of the active population 4.1 Description and evolution of the active population The aim of this chapter is to give a detailed description of the active population as well as the analysis of its two subsets in terms employed and unemployed of their spatial distribution, age sex distribution and their distribution according to other social demographic characteristics such as level of education, nationality, etc. The employed population is also analysed in respect of some labour market characteristics such as occupation, branch of economic activity, status in employment, etc Distribution of the active population by employment status The active population consists of the population aged 16 and above who were employed or unemployed during the reference period of seven days before the 2012 General Population and Housing Census night (15 August 2012). The enumerated total active population was 4,300,558. The share of the employed population was 96.6% while 3.4% of the active population were unemployed (Figure 11). Figure 11: Composition of the active population Distribution of the active population by sex Figure 12 below shows the distribution of the active population by sex and province. The proportion of active females was higher than the one of males at the national level as well as in all provinces except Kigali. At the national level; females represented 52% of the active 31

50 population. Across the provinces, the share of females fluctuated between 52% and 55% while in Kigali it was only 42%. Figure 12: Distribution of the active population by sex and province Evolution of the active population between 1978 and 2012 Figure 13 below shows the evolution of the active population aged 16 and above between 1978 and The active population increased from 2,347,033 to 3,321,929 between 1978 and Between 1991 and 2002 the active population decreased to 3,239,434 before increasing again to 4,300,558 between 2002 and The reasons for the decrease observed between the 1991 and 2002 censuses are the war and the genocide against the Tutsi, which happened in Rwanda during the period. The figure also shows that males were more affected than females. 32
51 Figure 13: Evolution of the active population aged 16 and above, Source: 1978, 1991, 2002 and 2012 Rwandan Population and Housing Censuses. Notes: The active population of the 1991 Population Census as presented in Figure 13 is aged 15 and above instead of 16 and above. 4.2 Employed population Spatial distribution, age sex structure and background characteristics of the currently employed population The findings of the 2012 Census as presented in Table 13 below showed that of 4,152,682 employed persons aged 16 and above, 2,154,670 were females (52%). The highest percentage of the employed population was in rural areas (84%). The employed population in urban areas was dominated by males, while the employed population in rural areas was dominated by females. 33
52 Table 13: Distribution (number and percentage) of the currently employed population aged 16 and above by area of residence, province and sex Province and area of residence Count Percentage Male Female Both Sexes Male Female Both Sexes Area of residence Urban 379, , , Rural 1,618,949 1,877,416 3,496, Province Kigali City 267, , , Southern 463, , , Western 433, , , Northern 339, , , Eastern 493, ,224 1,028, Rwanda 1,998,012 2,154,670 4,152, As for the province of residence, the Eastern Province represented one-fourth of the total employed population, followed by the Southern Province with 24%. Kigali City represented only 11% of the total employed population in Rwanda. Table 13 shows that the distribution of employed persons by sex in Kigali City was different from the distribution in other provinces. In all other provinces females made up a larger percentage of employed persons than males; the situation in Kigali City was the opposite, whereby 60% of employed persons were males against 40% females. The age sex distribution of the employed population of Rwanda as presented in Figure 14 reveals that the highest percentage of the working population during the Census was aged between 25 and 29 for both males and females: 18% for males and 17% for females. The age sex distribution of the employed population shows that the resident employed population was dominated by young persons. Almost half (49%) of the employed population was aged between 20 and 34 years old.(table 41and Table 42 in Annex D). Even though some people of advanced age (85 and above) were found to still be working, the proportion of older persons in the working population was low. Persons aged 65+ represented only 3% of all employed persons. The proportion of older working persons tends to be higher among older women than among older men. 34


53 Figure 14: Age sex distribution (%) of the currently employed population (Rwanda) The fact that the working population of Rwanda is young is also proved by the mean and median age of the employed population as presented in Figure 15 below. It shows that the mean age of the employed population at national level was 35.6 years and respectively 32.6 and 36.2 in urban and rural areas, while the median age was 32 at national level and respectively 32.6 and 33.0 in urban and rural areas. The difference between the mean age and median age in rural areas indicates that most of older working persons were concentrated in rural areas rather than urban areas. Figure 15: Mean and median age of the employed population aged 16 and above Table 14 presents the distribution of the employed population aged 16 and above by the highest level of education attended and sex. The results show that the level of education of the employed population in Rwanda is still low. The highest level of education of 87% of the employed population was primary or no education and only 3% had attended university. 35
54 The level of education among employed men was higher than the level of education among employed women. According to the results, 89% of employed women had not gone beyond primary-level studies at the time of the Census and that percentage among employed males was 85%. Furthermore, the percentage of employed males with university-level education was almost twice as high as the percentage among females: respectively 3.3% and 1.8% for males and females. Even though the level of education of the employed population is low, there has been some improvement over the time. Looking at previous censuses results, the percentage of the employed population with primary school education or less decreased from 98% in 1978 to 93% in 2002 and to 87% in 2012; and the percentage of the employed population with a level of education beyond primary school increased from 5% in 1991 to 13% in The comparison of the levels of education of the employed population according to the area of residence shows that the structure of the labour market in rural and urban areas is different. While the percentage of the employed population whose highest level of education was beyond primary school was 37% in urban areas, it was only 8% in rural areas. This may be due to the difference in the type of jobs between the two areas of residence.(table 44 in Annex D). Table 14: Distribution (number and percentage) of the currently employed population aged 16 and above by level of education and sex Level of education Male Number Female Both Sexes Male Percentage Female Both Sexes Never attended 407, ,227 1,057, Pre-primary 4,865 5,206 10, Primary 1,276,640 1,266,934 2,543, Post-primary 32,477 27,972 60, Lower secondary 100,504 80, , Upper secondary 96,194 72, , University 66,177 37, , Not stated 13,415 13,716 27, Total 1,998,012 2,154,670 4,152, Table 15 shows the distribution of the employed population aged 16 and above by the highest degree obtained and sex. 93% of the employed population did not have any degree, 4% had a secondary degree and only 2% had a university degree. Like Table 14, Table 15 shows that employed males were more highly educated than employed females. On the one hand, 95% of employed females were without any degree, while that proportion was 92% amongst employed males. On the other hand, employed females who had a university degree represented 1% of all employed females while the share of the same category amongst males was 2%. 36
55 Table 15: Distribution (number and percentage) of the currently employed population aged 16 and above by highest degree obtained and sex Highest degree obtained Count Percentage Male Female Both Sexes Male Female Both Sexes None 1,834,226 2,040,142 3,874, CE/FM 16,412 13,659 30, EMA/ENTA , A3/D4/D5 3,848 2,072 5, A2/D6/D7 88,556 68, , Bacc/Diploma 12,056 7,616 19, Bachelor s 35,305 19,416 54, Master s 5,388 1,893 7, PhD 1, , Not stated Total 1,998,012 2,154,670 4,152, Table 16 presents the distribution of the employed population aged 16 and above by nationality and sex. The results show that almost all of the employed population had Rwandan nationality (99.2%), and 0.2% who had dual nationality. The remaining percentage was divided among different nationalities. Among non-rwandans, Burundians predominated with 8,628 employed persons, followed by DRC nationals with 3,637 and then Ugandans with 2,643. As mentioned above, the findings for DRC nationals need to be interpreted with caution as many residents DR Congolese are refugees and were not administered the questions on economic activity. Among the East African Community countries, Tanzania has the lowest number of employed persons in Rwanda. Looking at the employed persons from outside Africa, Asia was the continent with the highest number of employed persons in Rwanda (1,182) while Oceania had the fewest, with only 11 persons. Unlike the Rwandese, where the number of employed females was slightly higher than that of employed males, the number of employed males was far higher than that of employed females for other nationalities. Only 30% of foreign workers were women. 37
56 Table 16: Distribution (number) of the currently employed population aged 16 and above by sex, area of residence and nationality Nationality Count Male Female Both Sexes Rwanda only 1,977,693 2,142,869 4,120,562 Rwanda and other 5,474 4,339 9,813 Burundi 6,114 2,514 8,628 Tanzania Kenya Uganda 1, ,643 DRC 2,550 1,087 3,637 Other African country Europe America Asia ,182 Oceania Not stated 1,392 1,864 3,256 Total 1,998,012 2,154,670 4,152,682 Table 17 presents the number and percentage of the employed population by disability status. 5% of the employed population suffered from a disability at the time of the census operations. More males with disabilities (5.2% of employed males) than females (4.5%) were represented in the employed population. A higher percentage of persons with disabilities were observed among the employed in rural areas than was the case in urban areas. Table 17: Distribution (number and percentage) of the currently employed population aged 16 and above by sex, area of residence and disability status Count Percentage Area of residence and disability status Male Female Both Sexes Male Female Both Sexes Rwanda With disabilities 104,626 97, , Without disabilities 1,893,386 2,057,551 3,950, Total 1,998,012 2,154,670 4,152, Urban With disabilities 12,010 6,700 18, Without disabilities 367, , , Total 379, , , Rural With disabilities 92,616 90, , Without disabilities 1,526,333 1,786,997 3,313, Total 1,618,949 1,877,416 3,496, During the Census a question on language of literacy was asked. The head of the household was asked a question about the languages each member aged at least three years old is able to read, to write and to understand. The findings from that question were analysed among employed population aged 16 and above and the results are presented in Table 18 below. In this table, the focus was put only on the official languages of Rwanda, and combinations with other languages were re-grouped (for example, if language of literacy was stated to be Kinyarwanda and other, the respondent was considered as literate in Kinyarwanda only. The same applies to the example of English, French and other which was re-grouped to English and French. For the full distribution see Table 45in Annex D). 38
57 The results show that 55% of the employed population in Rwanda could write and read Kinyarwanda only. The percentage of the employed population that was not able to either read or write any language was 33%. This applied to a larger share of females (38% of employed females) compared to males (27%). As far as the employed population with literacy in multiple languages is concerned, the results show that 5% used Kinyarwanda, English and French, 4% used Kinyarwanda and French while 2% were literate in Kinyarwanda and English. Multiple languages are more common among those who live in urban areas than among those in rural areas. In fact, those who use all three languages made up 10% of the urban employed population compared with just 2% in the rural areas. Similarly, the percentage of the employed population who are literate in both Kinyarwanda and French was 9% in the urban areas while it was 3% in the rural areas (Table 45 in Annex D). Table 18: Distribution (number and percentage) of the currently employed population aged 16 and above by language(s) of literacy and sex Count Percentage Language(s) of literacy Both Both Male Female Male Female Sexes Sexes None 547, ,066 1,361, Kinyarwanda only 1,153,905 1,127,667 2,281, English only 6,427 3,975 10, French only 4,126 2,984 7, Kinyarwanda and English 49,894 35,054 84, Kinyarwanda and French 98,120 76, , English and French 2,251 1,298 3, Kinyarwanda, English and French 124,251 79, , Other only 2,563 1,524 4, Not stated 9,096 11,851 20, Total 1,998,012 2,154,670 4,152, Main occupation Table 19 shows the distribution of the employed population by occupation according to sex. The results show that the predominant occupation in Rwanda during the RPHC4 was agricultural forestry and fishery work, which accounted for 73% of the employed population. The other occupations with high prevalence were service and sales workers (9%), craft and related trades workers (6%) and elementary occupations (5%). As expected, the occupational structure is different in urban areas compared to rural areas. While 83% of the employed population was involved in agriculture in the rural areas, that percentage was only 21% in urban areas (Table 19).Employment occupations for males and females were dominated by agriculture, representing 82% of employed females compared to 63% of employed males. This pattern is also observed in urban as well as in rural areas (Table 46 in Annex D). 39

58 Table 19: Distribution (numbers and percentages) of the currently employed population aged 16 and above by main occupation and sex Main occupation Count Percentage Male Female Both Sexes Male Female Both Sexes Rwanda Managers 10,589 5,442 16, Professionals 59,647 46, , Technicians and associate professionals 21,431 12,840 34, Clerical support workers 7,227 8,021 15, Service and sales workers 202, , , Skilled agricultural, forestry and fishery workers 1,248,004 1,772,323 3,020, Craft and related trades workers 200,511 41, , Plant and machine operators, and assemblers 68,650 2,117 70, Elementary occupations 136,918 70, , Other/occupation not stated 42,042 36,380 78, Total: Rwanda 1,998,012 2,154,670 4,152, Males have a more diverse occupational structure than females. In all categories other than agricultural and clerical support workers, the proportion of males was higher than the proportion of females. Females are largely restricted to agriculture and services and sales work, a kind of possible occupational segregation. The occupational segregation index is a proxy indicator for equality of opportunity in employment and occupation. The index measures the extent to which labour markets separate male and female occupations. The value of the occupational segregation index ranges from 0 to1, 0 indicating no segregation and 1 indicating complete segregation. The index may be interpreted as the fraction of persons who need to change occupations to achieve zero segregation. The occupational segregation index was 0.20 at the national level and differences based on sex in occupations are remarkable in urban areas compared to rural areas (Figure 16). Figure 16: Occupational segregation index by area of residence 40

59 The evolution of agricultural and non-agricultural occupations, as presented in Figure 17 below, shows that there has been a shift from agricultural occupations to non-agricultural occupations over 30 years. Those aged 15 and above who were involved in non-agricultural work in 1978 represented 8% of the employed population. In 2002, that percentagewas12% among the employed population aged 16 and above; it kept growing and reached 27% in The percentage of males engaged outside of agriculture was higher than the percentage of females across the period and the shifting from agricultural to non-agricultural occupations was faster among males compared to females. Figure 17: Evolution of agricultural and non-agricultural occupations, Table 20 shows the distribution of the employed population aged 16 and above by their main occupation and the highest level of educational attendance. As expected the occupations which require high level skills were occupied by more educated people. The distribution shows that 72% of employed people with university education were managers (11%), professionals (48%) or technicians and associate professionals (13%). On the other hand, people with less education were involved in occupations that demand low levels of education. 87% of the population who had never attended school were working in agriculture and 5% of them in elementary occupations. It is important to note that the higher the education level, the greater the chances of entering an occupation other than agriculture. The results show that the chance of being involved in agriculture decreases from 87% to 76% if the person concerned has some primary education; from 76% to 46% if the level of education increases from primary to lower secondary; and 46% to 2% if the level of education increases from lower secondary to university. 41
60 Table 20: Distribution (%) of the employed population aged 16 and above by occupation and level of education Main occupation Never attended Preprimary Primary Postprimary Lower secondary Upper secondary University Managers Professionals Technicians and associate professionals Clerical support workers Service and sales workers Skilled agricultural, forestry and fishery workers Craft and related trades workers Plant and machine operators and assemblers Elementary occupations Other/occupati on not stated Total Count 1,057,967 10,071 2,543,574 60, , , ,172 4,125,551 The occupational segregation indexes by the highest level of educational attendance as presented in Figure 18 reveal that the occupational segregation index was higher among the employed population with a post-primary level of education (0.31), followed by those with lower secondary education (0.27). It is interesting to note that the lowest index was found among the population who has ever attended university (0.08) less than half the index at the national level. Total 42

61 Figure 18: Occupational segregation index by highest level of educational attendance Notes: (1) Occupational sex segregation index: The occupational sex segregation index is commonly used as a proxy indicator for equality of opportunity in employment and occupations. The index measures the extent to which labour markets are separated in male and female occupations. The value of the segregation index ranges from 0 to1, 0 indicating no segregation and 1 indicating complete segregation. The index may be interpreted as the fraction of persons who need to change occupations to achieve zero segregation (Labour force data analysis: guidelines with African specificities). The information collected during the RPHC4 allowed analysis of the relationship between the occupation and the employment status of the employed population aged 16 and above. The results show that service and sales work was the most common occupation for employees (21%) and self-employed persons not in agriculture (49%). All other remaining categories of employment status were dominated by agricultural occupations. The analysis of the main occupation, employment status and sex shows the interdependence of these variables. While it was most common for male employees to be craft and related trades workers (22%), for female employees the most highly represented category were services and sales work and agricultural work. The percentage of female employees involved in craft and related trades was only 3.2%. It is interesting to note that the position of professionals was occupied in higher proportions amongst employee females than amongst employee males, 17% and 10%, respectively (Table 46 in Annex D). 43
62 Employee Employer Self-employed in agriculture Self-employed in non-agriculture Contributing family worker Member of producers cooperative Other Status not stated Table 21: Distribution (%) of the employed population aged 16 and above by occupation and employment status Main occupation Total Managers Professionals Technicians and associate professionals Clerical support workers Service and sales workers Skilled agricultural, forestry and fishery workers Craft and related trades workers Plant and machine operators and assemblers Elementary occupations Other/occupation not stated Total Count 739,338 17,809 2,500, , ,336 13,338 5, ,165 4,152,682 Table 22 below shows the distribution of the employed population by occupation and institutional sector. The predominant occupations in the public sector were professionals (43%), services and sale workers (11%) and technicians and associate professionals (10%), while the predominant occupation in the private sector was agricultural (77%), followed by services and sales workers(9%). The Rwandan private sector is dominated by small-scale agricultural sector jobs; therefore, it is still weak in offering decent work compared to the public sector. The three main occupations that demand higher levels of education (managers, professionals, and technicians and associate professionals) were occupied by 60% of the employed population in the public sector while this percentage was only 1% in the private sector. The predominant occupations in non-governmental organisations were agricultural workers (27%) and professionals (26%). 44

63 Public Private NGO Not stated Total Public Private NGO Not stated Total Public Private NGO Not stated Total Table 22: Distribution (%) of the employed population aged 16 and above by occupation, institutional sector and sex Sex and Main occupation Both sexes Male Female Managers Professionals Technicians and associate professionals Clerical support workers Service and sales workers Skilled agricultural, forestry and fishery workers Craft and related trades workers Plant and machine operators, and assemblers Elementary occupations Other/occupation not stated Total: Rwanda The situation described above is also clearly displayed in Figure 19, which shows the distribution of the employed population by institutional sector, according to occupation. It is clear that the private sector dominates in low skill level occupations while the public sector dominates the occupations that require higher levels of education. Figure 19: Distribution of the employed population aged 16 and above by institutional sector and occupation 45
64 The distribution of the employed population by occupation, sex and institutional sector shows the interdependence between the three variables. While 51% of females employed by the public sector were professionals, that percentage was only 38% amongst males. On the other hand the proportion of males engaged as service and sale works in Public Sector (15%) was higher than females engaged in the same occupation (5%). In addition the proportion of males employed in craft and related workers in private sector were 11% whereas that proportion is 2% amongst females. Furthermore, most of females employed by NGOs are skilled agricultural, forestry and fishery workers (40%) while the highest proportion of males in NGOs is professionals (28%) (Table 48 in Annex D) Employment status Figure 20 shows the distribution of the employed population aged 16 and above by employment status according to sex. As expected the majority of the employed population in Rwanda were self-employed in the agriculture sector (62%), followed by employees (19%). The disaggregation of the employed population by employment status in their main job and sex reveals a relationship between employment status and sex. The percentage of the male employed population was more than twice as high as the percentage for the employed female population (26% and 12%). In contrast, the percentage of contributing family worker among employed females was twice as high as that of males. Similar differences were observed for those self-employed in non-agricultural occupations, where the percentages among the male and female employed populations were respectively 12% and 6%. Figure 20: Distribution of the currently employed population aged 16 and above by employment status and sex Figure 21 shows that the labour market structure according to employment status was different in urban areas compared to rural areas. The share of employees and self-employed 46
65 persons in the non-agricultural sector was higher in urban areas while the share of selfemployed persons in agriculture together with contributing family workers was higher in rural areas. In both urban and rural areas, males are more prevalent in more decent employment status (employee and self-employed in non-agriculture job) compared to females. Figure 21: Distribution of the employed population aged 16 and above by employment status, area of residence and sex Institutional sector of employment Table 23 shows the distribution of the employed population aged 16 and above by institutional sector, sex and area of residence. The results show that at the time of the RPHC4, 94% of the employed population were working in the private sector while the public sector employed 4%. Non-profit organisations employed only 1%. The private sector remained the largest sector in both urban and rural areas, accounting for 84% and 95% of the employed population aged 16 and above respectively. In urban areas the public sector percentage of the employed population was 11%, which was much higher than the figure in rural areas (3%). The results show that among both sexes the majority of employees were working in the private sector, with the percentage among females a little bit higher than the percentage among males (95% and 93%), However, in the public sector, six out of 10 employed persons were males. 47
66 Table 23: Distribution (number and percentage) of the currently employed population aged 16 and above by institutional sector of employment, sex and area of residence Count Percentage Area of residence and institutional sector Male Female Both Male Female Both of employment Sexes Sexes Rwanda Public 99,452 63, , Private 1,848,133 2,035,328 3,883, Non-profit institution 13,583 8,470 22, Not stated 36,844 47,390 84, Total 1,998,012 2,154,670 4,152, Urban Public 44,443 27,407 71, Private 316, , , Non-profit institution 6,005 3,406 9, Not stated 12,192 14,853 27, Total 379, , , Rural Public 55,009 36,075 91, Private 1,531,710 1,803,740 3,335, Non-profit institution 7,578 5,064 12, Not stated 24,652 32,537 57, Total 1,618,949 1,877,416 3,496, Branch of economic activity The branch of economic activity refers to the activity of the establishment in which an employed person worked in his or her main job during the seven days before the Census night. The tables were produced using the 21 broad categories of the International Standard Industrial Classification (ISIC) version 4. In this section, 21 categories were aggregated into three categories known as activity sectors (primary, secondary and tertiary). The primary sector includes agriculture, forestry and fishing as well as mining and quarrying. The secondary sector includes manufacturing; electricity, gas, steam and air conditioning supply; water supply, sewerage, waste management and remediation activities; and construction. The tertiary sector includes all the remaining categories. The analysis of the branch of economic activity reveals that 76% of the employed population were working in the primary sector, 6% in the secondary sector and 16% in the tertiary sector as shown in Figure 26. The predominant branch of economic activity in the primary sector was agriculture, which employed 75% of the employed population. In the secondary sector the predominant branches of economic activities were construction (3.4% of the employed population) and manufacturing (2.7%). The predominant branch of economic activity in the tertiary sector was wholesale and retail trade (Table 43in Annex D). The comparison of the 2012 Census with the previous 2002 Census as presented in Figure 22 shows that there has been a shift from primary jobs to the secondary and tertiary sectors. The primary sector s percentage of total jobs decreased by 12 percentage points, while, the percentage of the population employed by the secondary and tertiary sectors increased between 2002 and
67 Figure 22: Distribution of the currently employed population aged 16 and above by main activity sector in 2002 and 2012 The RPHC4 enumerated 954,875 employed people who were engaged in other sectors than agriculture. This represents 23% of all employed persons. Out of then on-agriculture sectors, those which employed an important number of workers were wholesale and retail trade (22%), construction (15%), manufacturing (12%) and households (11%). Employed females were predominant in some sectors such as wholesale and retail trade (29% of employed females), households (20% of employed females) while in others such as construction, transportation and storage their participation compared to males was very low. 49
68 Table 24: Distribution (number and percentage) of employed population involved in economic activities other than agriculture by industry and sex Industry Male Female Both Sexes Male Female Both Sexes Wholesale and retail trade; repair of motor vehicles and motorcycles 118,734 87, , Construction 131,155 11, , Manufacturing 72,947 37, , Activities of households as employers; producing for own use 48,483 58, , Transportation and storage 80,444 2,753 83, Education 39,844 31,695 71, Public administration and defense 30,336 9,239 39, Other service activities 27,326 9,270 36, Accommodation and food service activities 21,115 13,139 34, Human health and social work activities 13,484 15,929 29, Administrative and support service activities 19,649 5,227 24, Mining and quarrying 16,801 1,370 18, Professional, scientific and technical activities 9,018 4,011 13, Financial and insurance activities 7,560 5,330 12, Information and communication 4,240 1,485 5, Electricity, gas, steam and air conditioning supply 5, , Arts, entertainment and recreation 3,220 2,032 5, Activities of extraterritorial organizations/bodies 2,995 2,061 5, Water supply; sewerage, waste management and remediation activities 2, , Real estate activities Total 655, , , There are differences in the structure of the urban and rural industries. The agriculture sector in rural areas was four times as large, in terms of the share of the employed population, as the agriculture sector in urban areas. All other sectors were larger in urban areas compared to rural areas (Figure 23). Figure 23: Distribution of the currently employed population aged 16 and above by the predominant branches of economic activities and areas of residence 50
69 The distribution of the employed population by the branches of economic activities according to the highest level of education shows that the branch of economic activity and the level of education are interrelated. Except for employed persons who had attended university, the predominant branch of economic activities was agriculture, forestry and fishing. However, the predominance decreases with higher levels of education. In fact, it decreased from 90% among employed persons who had never attended the school to 47% among those with lower secondary level education and to 3% among those who had attended university. Looking at the branches of economic activities other than agriculture, those with primary education or below were most frequently employed in the wholesale and retail trade, and with the household as the employer. Among those whose highest level of education was post-primary education, the common branches of economic activity were construction (11%), wholesale and retail trade (7%) and manufacturing (7%). For those with lower secondary education as the highest level of education, wholesale and retail trade (12%) and construction (7%) predominated. Among those with upper secondary education as the highest level of education the most frequently recorded employment categories were education (22%) and the wholesale and retail trade (15%). Finally, for those whose highest level of education was university, the predominant branches of economic activities were education (25%), public administration and defence (15%) and human health and social work activities (12%) (Table 50: in Annex D). Table 25 shows that there were 868,783 new jobs between the two censuses of 2002 and This corresponds to an annual increase of 2.4%. The largest annual percentage increase was observed in administration and support services activities (83%), arts, entertainment and recreation (23%), financial and insurance activities (18%) as well as accommodation and food service activities (18%). On the other hand, the highest absolute increase in net new jobs was observed in agriculture (305,480), wholesale and retail trade (116,711), construction (99,718), and manufacturing (42,983). 51
70 Table 25: Evolution of the economic activity sectors among the population aged 16 and above from 2002 to 2012 Industry Increase Growth rate Administrative and support service activities 24, , Arts, entertainment and recreation 5, , Financial and insurance activities 12,890 2,398 10, Accommodation and food service activities 34,254 6,725 27, Information and communication 5,725 1,617 4, Mining and quarrying 18,171 5,185 12, Electricity, gas, steam and air conditioning supply 5,633 1,646 3, Construction 142,786 43,008 99, Water supply; sewerage, waste management and remediation activities 3,004 1,105 1, Transportation and storage 83,197 30,799 52, Manufacturing 110,539 42,983 67, Wholesale and retail trade; repair of motor vehicles and motorcycles 205,951 89, , Other service activities 36,596 16,156 20, Human health and social work activities 29,413 15,084 14, Education 71,539 39,937 31, Activities of households as employers; producing for own use 107,240 62,644 44, Professional, scientific and technical activities 13,029 8,246 4, Public administration and defence 39,575 28,172 11, Activities of extraterritorial organizations/bodies 5,056 3,740 1, Industry not stated 69,631 61,000 8, Agriculture, forestry and fishing 3,128,176 2,822, , Real estate activities Total: Rwanda 4,152,682 3,283, , Source: Rwanda Population and Housing Census 2002 and The distribution of the employed population by the branches of economic activities and employment status, as presented in Table 51 in Annex D, reveals that the branches accounting for the most employees were agriculture (27%) and construction (13%). The same branches of economic activities were responsible for the highest percentages of employers, respectively 43% and 15%. Those self-employed outside of the agricultural sector were mostly predominant in wholesale and retail trade (43%) and manufacturing (17%). Contributing family workers were predominant in agriculture (92%), while members of cooperatives were mostly working in agriculture (47%) and manufacturing (12%). 4.3 Unemployed population Size and composition of the unemployed population The RPHC4 enumerated 147,876 unemployed people and the majority of them were not looking for a job during the seven days before the Census night, followed by those who were looking for a job for the first time and lastly those who had worked before and were looking for a new job (Figure 24). 52
. Figure 25: Distribution of the unemployed population aged 16 and above by sex 4.3.")
71 Figure 24: Distribution of the unemployed population aged 16 and above by unemployment status The distribution of the unemployed population by sex shows that the majority of the unemployed population were females. The results show that six out of 10 unemployed persons were females (Figure 25). Figure 25: Distribution of the unemployed population aged 16 and above by sex Spatial distribution of the unemployed population aged 16 and above The distribution of the unemployed population by province as presented in Figure 26 shows that Kigali City was the province with the highest percentage of unemployed persons in Rwanda (31%) and the lowest percentage was found in the Northern Province (10%). The 53

72 Eastern Province had more new job seekers than any other province (28% of the country). Kigali City and the Southern Province accounted for the highest percentages of first job seekers and those who were not seeking a job respectively. Figure 26: Distribution of the unemployed population aged 16 and above by province and unemployment status The distribution of the unemployed population by area of residence in Figure 27 shows that 63 out of 100 unemployed persons live in rural areas. This is obvious because a great number of working-age persons live in rural rather than urban areas (82% and 18% respectively). Figure 27: Distribution of the unemployed population aged 16 and above by area of residence The results in Figure 28 reveal that the status of the unemployed population is related to the area of residence. While the highest proportion of first job-seekers was reported amongst the unemployed population in urban areas (44%), most of the unemployed population in rural areas were new-job seekers (35%). 54

73 Figure 28: Distribution of unemployed population by unemployment status, sex and area of residence Age sex structure and background characteristics of the unemployed population Figure 29 shows the age sex distribution of the unemployed population aged 16 and above. Young people aged between 20 and 29 make up most of the unemployed. Part of this of course is due to an age effect (given that the Rwandan population is generally young) but also because this age group is most likely to be still at school, but available to work, or they have just finished school and are looking for their first jobs. 55
74 Figure 29: Age sex distribution of the unemployed population aged 16 and above Table 26 again reveals a strong age dynamic among the different categories of unemployed. 54% of unemployed who had previously been employed were below 35, while among those seeking a job for the first time 77% were below 35 and among those unemployed but not seeking a job during the seven days before the Census night this is true of 69%. Table 26: Age distribution of the unemployed population aged 16 and above Age group New job seeker First job seeker Available/Not seeking Total New job seeker First job seeker Available/Not seeking ,730 2,871 5,264 10, ,850 13,938 13,541 33, ,366 13,338 13,138 33, ,194 6,904 8,601 21, ,229 3,523 5,069 12, ,425 2,623 3,819 9, ,893 1,783 2,891 7, ,739 1,468 2,724 6, , ,686 4, , ,068 2, , Total 40,663 48,370 58, , Total Figure 30 below shows that the unemployed in urban areas tended to be younger than those in rural areas. In urban areas, 76% of unemployed persons were under 35, whereas this is only true for 63% of the unemployed in rural areas. 56
75 Figure 30: Distribution of the unemployed population aged 16 and above by age group and area of residence Table 27 presents the distribution of the unemployed population by age group, unemployment status and school attendance status. One can imagine situations where the head of the household (who was in most of cases the respondent or the Census questionnaire) might have reported full-time students as available to work. 57
76 Table 27: Distribution (%) of unemployed population by age group, unemployment status and school attendance status School attendance status and Unemployment status current education status and age Total New job seeker First job seeker Available/Not seeking group Currently attending school Total Count 3,204 3,729 4,118 11,051 Not currently attending school Total Count 37,459 44,641 54, ,825 All unemployed Total Count 40,663 48,370 58, ,876 Table 28 below shows that the highest proportion of the unemployed population has not gone beyond primary school. This proportion was 65% at the national level and it reached 80% in rural areas. More skilled unemployed persons were concentrated in urban areas, where the proportion of those who have attended at least upper secondary school was 45%.Regardless of the unemployment status or the area of residence, primary school is the highest level of education of most unemployed persons. This can indicate inadequate skills to fit new job opportunities. Those with upper secondary levels constitute the next-largest group of first job seekers after those with primary school levels. These persons are mainly young people who just finished their studies and are entering the labour market. In contrast, the majority of unemployed persons who had worked before did not go beyond primary school education. 58
77 Table 28: Distribution of the unemployed population aged 16 and above by the highest level of education, unemployment status and area of residence Area of residence and Level of education New job seeker First job seeker Count Available/Not seeking Total New job seeker First job seeker Percentage Available/Not seeking Rwanda Never attended/preschool 10,717 5,369 10,245 26, Primary 22,131 18,026 29,557 69, Lower secondary/postprimary 3,224 4,316 5,303 12, Upper secondary 2,822 14,061 8,866 25, University 1,282 6,170 4,372 11, Not stated , Total 40,663 48,370 58, , Urban Never attended/preschool Primary 3,460 7,530 8,304 19, Lower secondary/postprimary 1,157 2,972 3,114 7, Upper secondary 1,594 7,479 5,623 14, University 982 5,167 3,772 9, Not stated Total 8,161 24,453 22,479 55, Rural Never attended/preschool 9,837 4,279 8,763 22, Primary 18,671 10,496 21,253 50, Lower secondary/postprimary 2,067 1,344 2,189 5, Upper secondary 1,228 6,582 3,243 11, University 300 1, , Not stated Total 32,502 23,917 36,364 92, Figure 31 below shows that most unemployed were females regardless of the highest level of education (and this disparity clearly exceeds the generally higher number of females than males in the population).the greatest disparities were found among the population with a low level of education. This means that the more highly people are educated, the smaller the disparities in unemployment observed between women and men. Total 59

78 Figure 31: Distribution of the unemployed population by sex and highest level of education attained Looking at the relationship between unemployment and the highest degree/diploma/certificate obtained, Table 29 below shows that the unemployed population was dominated by those who had no degree/certificate regardless of their unemployment status. This category is followed by the holders of secondary school degrees who represented 29% of first-job seekers and 15% of those who were not seeking a job during the reference period. The newcomers to the labour market included 8% who obtained a university degree. This group represented only 4% among those not seeking a job but available to work. Table 29: Distribution of the unemployed population aged 16 and above by the highest degree obtained Highest degree obtained New job seeker First job seeker Count Available/Not seeking Total New job seeker First job seeker Percentage Available/Not seeking None 36,565 28,759 46, , CE/FM EMA/ENTA A3/D4/D A2/D6/D7 2,489 14,150 8,649 25, Bacc /Diploma 229 1, , University degree Not stated Total 40,663 48,370 58, , Table 30 is about the distribution of the unemployed population aged 16 and above by nationality. The results show that 99% of unemployed people were Rwandese. 58,201 unemployed Rwandans, which represented 40% of the Rwandese unemployed population, were available for work but not seeking a job during the reference period (seven days before the Census night). 47,630 (33%) of them were looking for their first job and 40,351 (28%) of them were looking for a new one. Total 60
79 Among other unemployed foreign nationals, the population from the DRC was the largest, with 382 unemployed persons (but as mentioned above this excludes DRC nationals that were refugees, due to no economic activity questions being administered in institutional households), followed by Burundians and Ugandans with respectively 209 and 105 unemployed persons. Table 30: Distribution (count) of the unemployed population aged 16 and above by nationality Area of residence and nationality Count New job seeker First job seeker Available/Not seeking Total Rwanda only 40,351 47,630 58, ,182 Rwanda and other Burundi Tanzania Kenya Uganda DRC Other African country Europe Americas Asia Oceania Not stated Total 40,663 48,370 58, ,876 The results presented in Table 31 below indicate that 8,872 persons with disabilities were unemployed, representing 6% of the unemployed population. The majority of persons with disabilities were either available for work but not looking for a job or were looking for a new job. Table 31: Distribution (count and percentage) of the unemployed population aged 16 above by disability status and area of residence Sex, area of residence and disability status New job seeker First job seeker Count Available/ Not seeking Total New job seeker Percentage First job seeker Available/ Not seeking Rwanda With disabilities 3,027 2,236 3,609 8, Without disabilities 37,636 46,134 55, , Total 40,663 48,370 58, , Urban With disabilities Without disabilities 7,766 23,761 21, Total 8,161 24,453 22, Rural With disabilities 2,632 1,544 2,864 7, Without disabilities 29,870 22,373 33,500 85, Total 32,502 23,917 36,364 92, Total 61
80 Chapter 5: Characteristics of the inactive population 5.1 Composition and spatial distribution of the inactive population The inactive population which will be analysed in this section consists of the resident persons aged 16 and above who were neither employed nor unemployed during the reference period. The total number of inactive persons enumerated during the Census was 1,545,708, which represented 26% of the population aged 16 and above. A high proportion (79%) of the inactive population was, unsurprisingly, found in rural areas as most Rwandans live in rural areas. The inactive population is composed of the following categories: students, those looking after their family/home, retired people, elderly people and other inactive people who are not classified. Students constitute the highest proportion among the inactive population at the national level as well as in both urban and rural areas (around 50%).These are followed by those looking after the family/home (24%). The inactivity status is highly related to the sex. While 6 out 10 of inactive males are students, the proportion of students among females is 30%. On the other hand, the proportion of those looking after the family/home is twice as high among females when compared with males. Those differences are observed in both areas of residence; however they are more predominant in urban areas (Table 32) Table 32: Distribution of the inactive population aged 16 and above by inactivity status Sex and Status Count Percentage Rwanda Urban Rural Rwanda Urban Rural Both Sexes Looking after family/home 380,716 87, , Retired 14,363 4,657 9, Old age 159,011 18, , Student 785, , , Other 207,244 45, , Total 1,545, ,661 1,213, Male Home worker 99,784 13,468 86, Retired 6,614 2,377 4, Old age 54,794 5,546 49, Student 402,483 88, , Other 97,909 21,654 76, Total 661, , , Female Home worker 281,415 73, , Retired 7,676 2,207 5, Old age 103,747 12,840 90, Student 383,148 87, , Other 108,830 24,075 84, Total 884, , , The results shows that the majority of the inactive population were students (51%), followed by those looking after their family/home (25%). The category of others, which comprised 13% of the total inactive population, may include young people who were not students. The category of retired persons refers to the persons who had ever held a formal job and who were retired from that job at the time of the Census, while the category old age, which 62
.")
81 makes up 10%, refers to the older persons who were not receiving pension benefits because of the nature of their previous jobs. The distribution of the inactive population by sex as presented in Figure 32 shows that women constituted the majority of economically inactive persons (57%). Figure 32: Distribution of the inactive population aged 16 and above by sex Among both males and females, the majority of the inactive persons were students; however, there were more male than female students among the inactive population. This situation was also observed in all provinces, but the discrepancy was greatest in Kigali City and smallest in the Northern Province. Table 33 below shows the distribution of the inactive population aged 16 and above by province according to sex. The Southern Province had the highest percentage of the inactive population followed by the Western Province. The lowest percentages of the inactive population were found in the Northern Province and Kigali City. Table 33: Distribution (number and percentage) of the inactive population aged 16 and above by area of residence and province, disaggregated by sex Province and area of Count Percentage residence Male Female Both Sexes Male Female Both Sexes Kigali City 86, , , Southern 173, , , Western 153, , , Northern 93, , , Eastern 154, , , Total 661, ,129 1,545, Source: Fourth Rwanda Population and Housing Census 5.2 Age sex structure of the inactive population The age sex distribution of the inactive population aged 16 and above as presented in Figure 33 below shows that for those outside the labour force the predominant group 63
82 isagedbetween16 and 19as a substantial number of those in this age group are in education. Two age groups (16 19) and (20 24) represented 58% of the entire inactive population. The percentage of the inactive population decreases with age (which is partly an age effect given that the population of Rwanda is generally young). It is important to note that the youngest group (between 16 and 29) was more strongly represented among inactive males than inactive females, while the opposite is true for the older groups aged 30 and above. This may be caused by the domestic responsibilities of females after being married. The same situation is observed in both urban and rural areas; however, the changes in rural areas occur earlier than in urban areas, for the females in rural areas tend to marry earlier than those in urban areas (Table 58, Table 59 and Table 60 in Annex D). Figure 33: Age sex distribution of the inactive population aged 16 and above Table 34 is about the mean and median age of the inactive population aged 16 and above by sex, province and area of residence. The mean age of the inactive population in Rwanda was 32 while the median age was 22. The mean as well as the median age was higher among females (34 and 24) compared to males (29 and 21). The mean age ranged from 30 in Kigali City to 33 in the Southern Province while the median age ranged from 21 in Northern Province to 24 in Kigali City. Irrespective of the province the mean and median ages were higher among females than males. 64
83 Table 34: Mean and median age of the inactive population aged 16 and above bysex, province and area of residence Province and Male Female Both Sexes area of residence Population count Mean age Median age Population count Mean age Median age Population count Mean age Median age Rwanda 661, , ,545, Urban 132, , , Rural 529, , ,213, Province Kigali City 86, , , Southern 173, , , Western 153, , , Northern 93, , , Eastern 154, , , Background characteristics of the inactive population Table 35 shows that the level of education of 60% of inactive persons was not beyond primary, and that 24% had attended or were still attending lower secondary school. The distribution of the inactive population by area of residence shows some differences in the structure of that population based on the highest level of education. Inactive persons who had never attended school represented 11% of the inactive population in urban areas and 22% in rural areas. In addition; the percentage of inactive persons with university education was six times higher in urban areas than in rural areas. 65
84 Table 35: Distribution (number and percentage) of the inactive population aged 16 and above by level of education, area of residence and sex Area of residence and Level of Count Percentage education Male Female Both Sexes Male Female Both Sexes Rwanda Never attended/preschool 88, , , Primary 271, , , Post-primary/Lower secondary 175, , , Upper secondary 81,265 84, , University 37,420 28,618 66, Not stated 7,202 9,556 16, Total 661, ,129 1,545, Urban Never attended/preschool 8,598 28,007 36, Primary 34,269 67, , Post-primary/Lower secondary 37,158 47,510 84, Upper secondary 29,549 35,694 65, University 20,804 19,738 40, Not stated 1,660 2,328 3, Total 132, , , Rural Never attended/preschool 80, , , Primary 237, , , Post-primary/Lower secondary 138, , , Upper secondary 51,716 48, , University 16,616 8,880 25, Not stated 5,542 7,228 12, Total 529, ,506 1,213, Table 36 below presents the distribution of the inactive population by nationality and sex. Almost all inactive persons were Rwandese (99.5%). Among foreign residents, the DRC had the highest number of inactive persons (1,975, again this excludes persons living in refugee camps), followed by Burundi (1,371) and Uganda (437). Table 36: Distribution (number) of the inactive population aged 16 and above by nationality, area of residence and sex Area of residence and nationality Count Male Female Both Sexes Rwanda only 656, ,434 1,533,886 Rwanda and other 2,239 2,923 5,162 Burundi ,371 Tanzania Kenya Uganda DRC 749 1,226 1,975 Other African country Europe Americas Asia Oceania Not stated 1, ,990 Total 661, ,129 1,545,708 The distribution of the inactive population aged 16 and above by disability status and sex as presented in Table 37 below reveals that 11% of the inactive population were disabled. The majority of them were living in rural areas; 12% of inactive persons in rural areas were 66
85 disabled, compared to 6% in urban areas. The percentages of persons with disabilities among inactive persons were almost the same in both sexes at the national level and in rural areas; and a very small difference was observed in urban areas, where a higher percentage of males in the economically inactive population was disabled. Table 37: Distribution (number and percentage) of the inactive population aged 16 and above by disability status and sex Area of residence and Count Percentage disability status Male Female Both Sexes Male Female Both Sexes Rwanda With disabilities 72,506 94, , Without disabilities 589, ,361 1,378, Total 661, ,129 1,545, Urban With disabilities 8,208 10,583 18, Without disabilities 123, , , Total 132, , , Rural With disabilities 64,298 84, , Without disabilities 465, ,321 1,064, Total 529, ,506 1,213,
86 Conclusion The analysis of economic activity and labour force participation in Rwanda has focused on the population aged 16 and above to identify different characteristics of the currently active and inactive populations. The structure of both populations showed that 71% of the resident population were employed while 3% of them were unemployed and 26% were inactive. The active population, which consists of employed and unemployed persons, represented 74% of the population aged 16 and above. Females were predominant in the active population and also constituted the majority of the working-age population. Even though the employment rate in Rwanda is high (97%), the unemployment rate, which reflects an unbalanced labour market, is growing and is more remarkable among young people who are living in urban areas, especially those who have at least a secondary level of education. Although the majority of employed persons were females (52%), they were mainly working in the agriculture sector. Labour force participation in Rwanda increases rapidly with age for young persons, peaks around the age and then decreases slowly but steadily with increasing age. The fact that a high number of older people keep working even after they reach the official age for retirement, indicates an economy where a person is obliged to work in order to survive. The level of education among those currently employed is still weak; only 2% had at least a Bachelor s degree. A similar situation was observed among unemployed persons,65% of whom had not gone beyond primary education. 26% of unemployed persons have attended secondary, and 8% university. The analysis indicated that the main occupation among the employed population was agriculture (73%) and a greater percentage of females were employed in agriculture (82%) than men (63%). Non-agricultural occupations were mostly present in urban areas and mostly occupied by men. The analysis of the main occupation and the institutional sector of employment showed that the private sector in Rwanda has to be strengthened. The three most common occupations which require high levels of education (managers, professionals, and technicians and associate professionals) accounted for the majority of employed persons in the public sector (60%) but only 1% in the private sector. Except for employees and self-employed persons not working in agriculture, who were largely services and sales workers, all other categories of employment were dominated by agriculture. The relationship between the main occupation and the level of education proved that the occupations which require high level education were occupied by educated people. 72% of employed people with university education were managers, professionals or technicians and associate professionals. On the other hand, people with less education were involved in 68
87 occupations that do not require high levels of education. 87% of employed persons who had never attended school were working in agriculture. Concerning employment status, the results showed that the majority of the employed population in Rwanda were self-employed in agriculture (60%), followed by employees (18%). The percentage of employed males who were employees was twice as high as the corresponding figure for women and the percentage of employed women who were contributing family workers was more than twice as high as the corresponding figure for men. The private sector employed 94% of employed persons including small-scale famers and the public sector employed only 4%.The analysis of the branches of economic activity revealed that the primary sector employed the majority of the population. However, there had been a significant shift to the non-agricultural sector during the previous 10 years. The percentage of agricultural workers in the employed population decreased from 88%in 2002 to 76% in The secondary and tertiary sectors grew between 2002 and 2012 and the fastest growing branches of economic activity were accommodation and food service, construction, and transportation and storage. The majority of the inactive population were students (51%),followed by home workers (25%). However, the student percentage of inactive males (61%) was higher than the figure for inactive females (43%). The highest level of education for 40% of the inactive population was primary and 24% of all inactive persons had attended or were still attending lower secondary school. In general, the measurement of economic activity through the RPHC4 is limited to selected indicators which can be measured by a population census. Like other population censuses, it has not captured employment characteristics such as working hours, income from work and informal employment which are usually measured by specific employment surveys. Consequently, some important indicators such as the underemployment rate (which shows the insufficiency of the volume of work among the employed population) could not be computed. It is also worth noting that the information presented in this report is limited to the main activity performed during the reference period (seven days before the Census night) while the working population of Rwanda routinely works in multiple jobs. Moreover, the data on economic activity from the RPHC4 are captured within a short reference fixed period. Thus the seasonality is disregarded while the majority of Rwandans works in agricultural activities which are heavily subject to annual seasons. In the next censuses both short and long reference periods could be used to capture the seasonality effects of the labour force. 69
88 References 1. African Development Bank (2012): Labour force data analysis: guidelines with African specificities, Tunis. 2. IPAR (2012): Rwanda case study on economic transformation, Kigali. 3. MIFOTRA (2007): National employment policy, Kigali. 4. MINECOFIN (2013): Economic development and poverty reduction strategy: , Kigali. 5. National Institute of Statistics of Rwanda (2011a): EICV3.Thematic report on economic activity, 2011, Kigali. 6. National Institute of Statistics of Rwanda (2011b): The evolution of poverty in Rwanda from 2000 to 2011, Kigali. 7. National Institute of Statistics of Rwanda (2007): Labour market and economic activity trend in Rwanda, Kigali. 8. National Institute of Statistics of Rwanda (2002): A synthesis of the analysis of the 2002 General Population and Housing Census in Rwanda, Kigali. 9. National Institute of Statistics of Rwanda (1984): Recensement général de la population et de l habitat 1978, vol VI. 10. National Institute of Statistics of Rwanda (1978): Recensement général de la population et de l habitat: Activité économique, Résultats définitifs, Vol II. 11. UN (1968): Method of analysing census data on economic activity of the population, New York. 70
89 Annex A Census objectives, methodology and data quality assessment A.1 Objectives of the Census The long-term objective of the Fourth Rwanda Population and Housing Census (RPHC4) is to contribute to: i. Improving the level of knowledge on the social, demographic and economic characteristics of the population of Rwanda; ii. Enabling a better understanding of population and development interrelationships; and iii. Reinforcing the National Institute of Statistics of Rwanda s(nisr) human and technical capacity. In the short term, the objectives of the Census are to: i. Determine the current size of the population of Rwanda and its spatial distribution among provinces, districts, sectors, cells and villages and among rural and urban areas; ii. Determine the present demographic, social, economic and cultural characteristics of the population of Rwanda; iii. Determine the level, structure and trends in regard to fertility, mortality and migration among the population in order to come up with the natural and overall growth rates of the population of Rwanda; iv. Provide indicators to enable advocacy for particular groups of the population such as women, children, youth, the elderly and disabled persons; v. Determine the characteristics of households, housing conditions and household welfare in Rwanda to further use this information for a more elaborate poverty mapping of the country; vi. Produce national population projections using updated demographic data and other information on population dynamics to enhance future planning; vii. Update the relevant databases, providing information right down to the smallest administrative unit in order to enhance the current Government policy on village clusters ; viii. Provide clear details of the current statutory boundaries of all administrative units of the country to which appropriate geographical codes can then be assigned; ix. Constitute an updated sampling frame for Rwanda and produce maps for each enumeration area for future sample surveys; and x. Promote the use of Census data at national and local level in formulating, monitoring and evaluation of development programmes. 71
90 A.2 Methodology and Census phases As mentioned in Chapter 1 of this report, following the preparatory phase of the Census which consisted of the production of the project documents, schedule and Census budget, the following technical activities were undertaken. A.2.1 Census mapping The purpose of the Census mapping is to divide the whole country into well-delineated enumeration areas that constitute the smallest operational Census units to be assigned to each enumerator during the enumeration period. The Census mapping operation lasted for about a year (from February 2011 to March 2012), which enabled the NISR to better estimate the number of staff to be recruited (e.g. enumerators, team leaders, supervisors, etc.) and the other Census infrastructure and facilities necessary for planning robust field activities. The outcomes of the Census mapping include the production of a new sampling frame for future surveys and an updated administrative area boundary map for Rwanda. In total, the country was delineated into 16,728 enumeration areas within the current boundaries of administrative units, consisting of five provinces, 30 districts and 416 sectors. This allows for the easy compilation of Census results in these administrative entities. A.2.2 Pilot Census Prior to the conducting of therphc4, a Pilot Census designed for testing the Census questionnaires, other Census data-collection tools, enumeration time requirements and the state-of-preparedness of the entire field work organisation was carried out. This test was conducted on a sample of 75 enumeration areas throughout all the districts of the country, from 16 to 30 August 2011, exactly one year before the actual Census. The Pilot Census was a dress rehearsal for the actual Census during which the various methods and procedures for field organisation were tested as well as the Census publicity/awareness campaign, Census map products and data-coding and data-entry equipment. The lessons learnt from the Pilot Census exercise were used to revise some Census procedures and instruments necessary for a smooth/successful implementation of the actual Census enumeration work. A.2.3 Questionnaires and manuals The first draft of Census questionnaires prepared by the NISR was submitted to the Census Technical Committee (CTC) for review before its approval by the National Census Commission (NCC). The CTC-reviewed Census questionnaires and related manuals were tested during the Pilot Census. The lessons learnt during the Pilot Census were used by the NISR to improve and finalise the Census questionnaires, containing 77 variables, as well as to revise the manuals of instructions for all Census functionaries accordingly. The revised Census questionnaires and 72
91 manuals were again reviewed and approved by the CTC before final approval was granted by the NCC to use the Census questionnaire for the RPHC4. The questionnaires used to collect data are presented in Annex B of this report. Two different types of questionnaires were administered one for private households and one for institutional households. The questionnaire for private households contained a person record, a household record and a mortality record. The questionnaire for institutional households contained only a person record. A.2.4 Census publicity and sensitisation campaign Prior to the conducting of Census enumeration a national publicity and sensitisation campaign was implemented in order to inform the public about the importance and relevance of the fourth Rwanda RPHC4, as well as to seek their active participation and the involvement and collaboration of administrative authorities during the Census enumeration period. A subtle and targeted publicity and awareness campaign was conducted before the Pilot Census, which was later intensified and diversified to cover all of the country as the actual Census enumeration period approached. The active collaboration and participation of Census commissions at both provincial and district levels in campaign activities contributed significantly to the success of the Census enumeration. The innovative mass-communication mix that was used to inform the public about the Census and, at the same time, to ask for their full participation in the RPHC4, included the following: (i) Census Commission meetings; (ii) Articles in local newspapers; (iii) Radio and television programmes; (iv) Outdoor billboards, banners, publicity spots and press releases; and (v) Monthly village community development meetings (Umuganda). The Census results published in this report attest to the high level of cooperation of the political and administrative authorities and the effective participation of the general public in the entire Census enumeration process. A.2.5 Recruitment and training of field staff The RPHC4 was conducted by personnel from various institutions: the NISR (the Census executing agency), MINECOFIN, MINALOC (districts and sectors), MINAFFET, the Rwanda Defence Force, the Rwanda National Police, the Rwanda Correctional Services and MINEDUC (heads of secondary schools and teachers). The recruitment of Census functionaries was done by each institution according to the needs (i.e. number and categories of staff) of the NISR, except in the case of teachers whose recruitment was done by the NISR in collaboration with administrative authorities at the district, sector and cell levels. 73
92 At each stage of Census implementation, the necessary induction and mandatory training for NISR staff and Census functionaries took place. For example, the Census mapping phase was preceded by the training of cartographers, while the Pilot Census and the actual Census enumeration were preceded by training of enumerators and their supervisors. About eight weeks prior to the commencement of actual Census enumeration cascading training was organised for all categories of Census functionaries, namely: (i) Core master trainers dialogue; (ii) Training for 275 master trainers; (iii) Training for 1,004 trainers organised in five training centres, one centre per province; and (iv)training for 24,426 enumerators in 68 training centres spread across all districts of the country. The Census training sessions focused on the understanding of Census enumeration processes and the correct completion of Census questionnaires, reading and interpretation of Census maps, practical role plays, and field practice. All the trainers and trainees were subjected to mandatory qualifying tests which they had to pass before being appointed. In order to mitigate the risk of declining quality of training at the various cascading training levels, the comprehensive enumerator training was voice-over simulated by core master trainers at a recording studio. The audio recorded training session was mass-recorded on CDs and distributed to all the training classes as a reference source for the trainers. A.2.6 Actual Census enumeration As initially planned, the actual Census enumeration of the population in private and institutional households was conducted across the country from 16 to 30 August to 2012, immediately after the Census reference night. Although data-collection activities were carried out by well-trained enumerators, quality assurance of the Census enumeration was ensured through close supervision by line managers at various levels. The Census functionaries deployed for the RPHC4 comprised the following personnel: (i) Enumerators and support staff; (ii) Team supervisors, covering an average of five enumeration areas each; (iii) Sector controllers; (iv) Zonal supervisors, covering between two and five administrative sectors; (v) District coordinators; (vi) Province coordinators; and (vii) National coordinators. In accordance with the instructions contained in the Census Manual, each manager oversaw and ensured the operations of daily Census activities within his/her area of supervision. Enumerators were accountable for the work done on a daily basis to their team leaders, who carried out the verification of completed questionnaires and also resolved to the best of their ability challenges and/or problems encountered. 74
93 The team leaders communicated their daily progress achieved to the innovative Census Command and Control Centre (CC&CC) established at the NISR using a SMS (i.e. Short Message Service) system. The CC&CC system was an open source and web-based system that allowed NISR senior management and authorised staff to continually monitor the progress of Census enumeration in all the 16,728 enumeration areas via the internet. These officials were also able to contact each other through a MTN Closed User Group. Prior to the conducting of Census enumeration, a robust field operations plan with worst case scenarios and risk analyses was established to facilitate hitch-free data collection and supervision of the work. Appropriate logistical support was made available to field staff, such as bicycles, motorcycles, vehicles and other necessary equipment. The mechanism utilised for the distribution of Census material for data collection as well as the repatriation of questionnaires and other materials to NISR headquarters was mainly facilitated by Rwanda Defence Force trucks. A.2.7 Post-enumeration activities The logistical arrangement employed for the repatriation, inventory of Census questionnaires and collating of Census counts was swift and seamless, which enabled the rapid publishing of the Provisional Census Report within 90 days of Census enumeration being concluded. The other post-enumeration activities included: the Post-Enumeration Survey (PES); data coding; data processing; the release of final results; thematic analysis; and the dissemination of Census results. The PES was conducted from 19 September to 3 October The aim of the PES was to assess the coverage and quality of Census data gathered during the actual Census. A total of 120 enumeration areas was sampled from across all districts of the country. The data-coding and data-processing activities were done concurrently and completed within six months. The Census data-cleaning, data-editing and data-stabilisation processes were completed in two months, after which approximately 1,000 basic Census data tables were generated. The final results were subjected to an in-depth analysis across 17 generic themes (one of which is presented in this report) in accordance with the analysis plan developed for each theme. Census monographs for each of the 30 districts will also be produced. A.3 Data quality assessment An independent quality review (available as an internal report to NISR) was conducted in parallel with the thematic analysis. This investigated the work done prior, during, and after enumeration to maximise the data quality. The assessment confirmed the strong planning and quality assurance throughout the enumeration to maximise representation of the population; but also found potentially weaker direct quality assurance during the data processing phase. The overall conclusion of the assessment is that the RPHC4was implemented with strong quality control and gives an excellent representation of the population of Rwanda with generally good measurement of its structure both in terms of spread and demographic and socio-economic characteristics. 75
94 The claim of high quality with respect to representation is confirmed by the Post-Enumeration Survey (PES), which measured the net-coverage of the household population in the RPHC4 to be over 99% nationally with little variation across regions and by age and sex. Gross under-coverage was around 1.5% while gross over-coverage (erroneous inclusions) was around 0.6%. The conclusion of excellent representation is also consistent with the plausible growth rate for the population over the inter-censal period implied by the national results. Analysis of the demographic and socio-economic information contained in the final RPHC4 database and triangulation with other data sources also confirm that for most areas, the RPHC4 gives a reliable and comprehensive representation of the population. However, some issues were found with respect to measurement of population characteristics: some possible under-reporting of males (especially at young ages), some age-heaping around the digits 0 and 2 as well as particular irregularities around the ages 2 and 12. Moreover, despite careful testing of the questionnaire with explicit enumerator instructions regarding these sections, there is also evidence of under-reporting of mortality, and to a lesser extent fertility. Indirect estimation may be appropriate in these two thematic areas. However, apart from these issues the analysis of the RPHC4 database supports the assertion of good quality with respect to measurement. 76
95 Annex B Census questionnaire This annex provides the key pages of the Census questionnaires. The full questionnaires including all cover sheets can be obtained from the NISR. As mentioned above, two different types of questionnaires were administered, one for private households and one for institutional households. The questionnaire for private households contained a person record, a household record and a mortality record. The questionnaire for institutional households contained only a person record. 77

96 B.1 Private households: person record 78
97 79
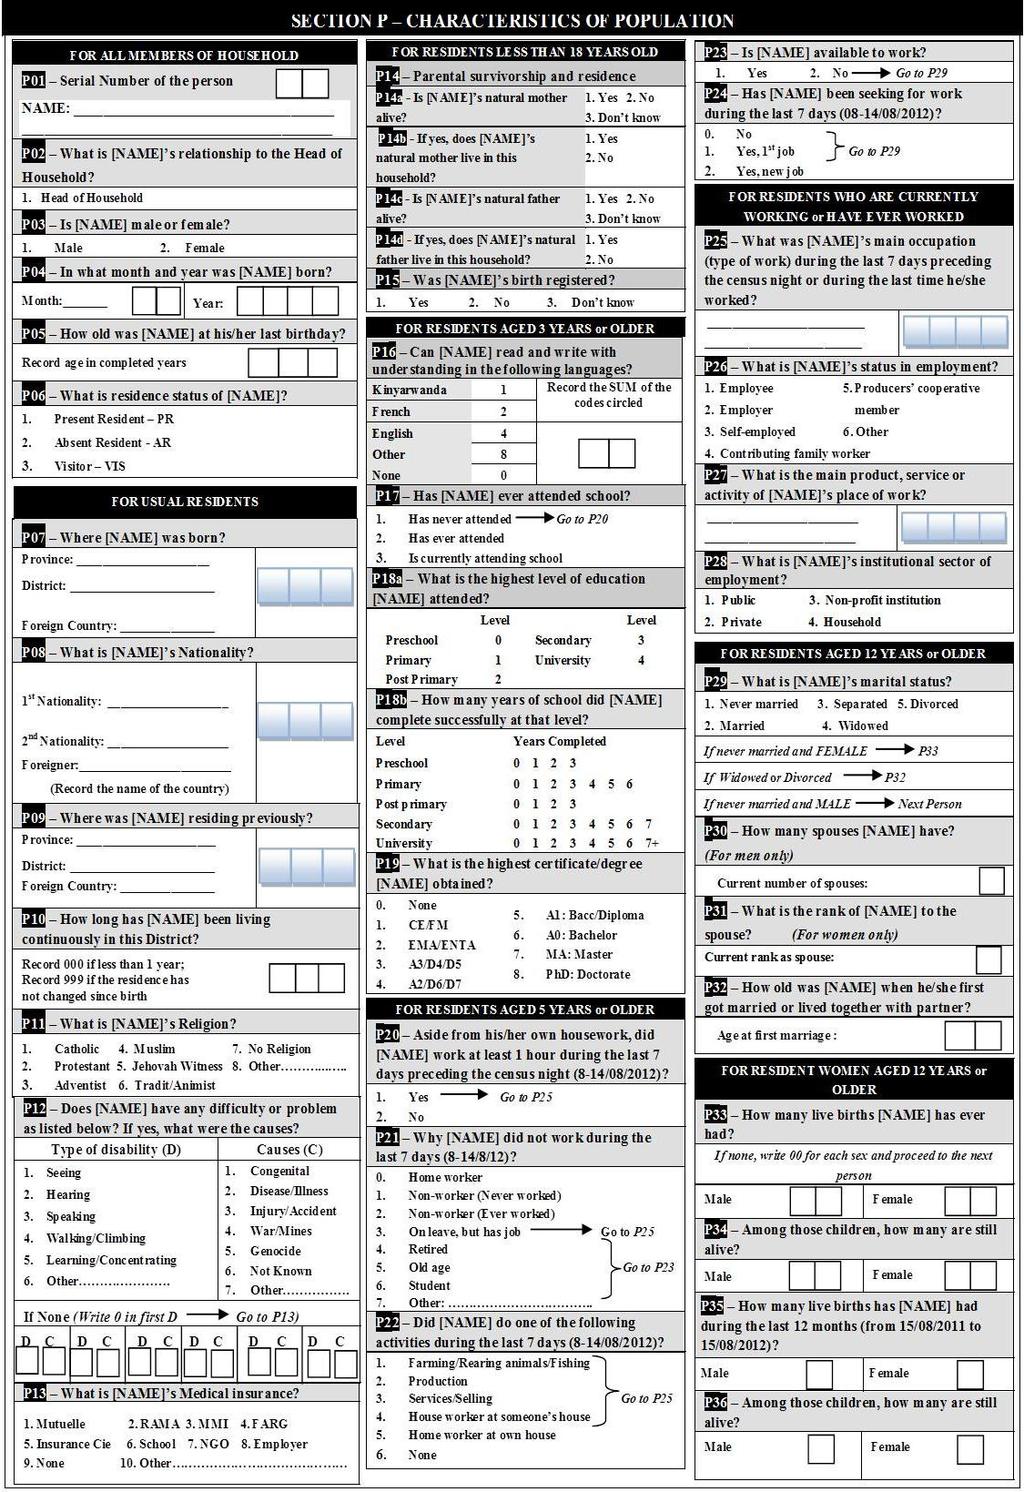
98 80
99 FOR ALL MEMBERS OF HOUSEHOLD P01 Serial Number of the person NAME: P02 What is [NAME] s relationship to the Head of Household? 2. Spouse 6. Brother/Sister 3. Son/Daughter 7. Grandchild 4. Unrelated Child 8. Other Relative 5. Father/Mother 9. Non Relative P03 Is [NAME] male or female? 1. Male 2. Female P04 In what month and year was [NAME] born? Month: Year: P05 How old was [NAME] at his/her last birthday? Record age in completed years P06 What is residence status of [NAME]? 1. Present Resident PR 2. Absent Resident - AR 3. Visitor VIS FOR USUAL RESIDENTS P07 Where [NAME] was born? Province: District: Foreign Country: P08 What is [NAME] s Nationality? 1 st Nationality: 2 nd Nationality: Foreigner: (Record the name of the country) P09 Where was [NAME] residing previously? Province: District: Foreign Country: P10 How long has [NAME] been living continuously in this District? Record 000 if less than 1 year; Record 999 if the residence has not changed since birth P11 What is [NAME] s Religion? 1. Catholic 4. Muslim 7. No Religion 2. Protestant 5. Jehovah Witness 8. Other Adventist 6. Tradit/Animist P12 Does [NAME] have any difficulty or problem as listed below? If yes, what were the causes? Type of disability (D) Causes (C) 1. Seeing 2. Hearing 3. Speaking 4. Walking/Climbing 5. Learning/Concentrating 6. Other. If None (Write 0 in first D P13) 1. Congenital 2. Disease/Illness 3. Injury/Accident 4. War/Mines 5. Genocide 6. Not Known 7. Other. D C D C D C D C D C D C P13 What is [NAME] s Medical insurance? 1. Mutuelle 2. RAMA 3. MMI 4. FARG 5. Insurance Cie 6. School 7. NGO 8. Employer 9. None 10. Other SECTION P CHARACTERISTICS OF POPULATION FOR RESIDENTS LESS THAN 18 YEARS OLD P14 Parental survivorship and residence P14a - Is [NAME] s natural mother alive? P14b - If yes, does [NAME] s natural mother live in this household? P14c - Is [NAME] s natural father alive? 1. Yes 2. No 3. Don t know 1. Yes 2. No P14d - If yes, does [NAME] s natural 1. Yes father live in this household? 2. No P15 Was [NAME] s birth registered? 1. Yes 2. No 3. Don t know 1. Yes 2. No 3. Don t know FOR RESIDENTS AGED 3 YEARS or OLDER P16 Can [NAME] read and write with understanding in the following languages? Kinyarwanda 1 Record the SUM of the French 2 codes circled English 4 Other 8 None 0 P17 Has [NAME] ever attended school? 1. Has never attended Go to P20 2. Has ever attended 3. Is currently attending school P18a What is the highest level of education [NAME] attended? Level Level Preschool 0 Secondary 3 Primary 1 University 4 Post Primary 2 P18b How many years of school did [NAME] complete at that level? Level Years Completed Preschool Primary Post primary Secondary University P19 What is the highest certificate/degree [NAME] obtained? 0. None 1. CE/FM 2. EMA/ENTA 3. A3/D4/D5 4. A2/D6/D7 5. A1: Bacc/Diploma 6. A0: Bachelor 7. MA: Master 8. PhD: Doctorate FOR RESIDENTS AGED 5 YEARS or OLDER P20 Aside from his/her own housework, did [NAME] work at least 1 hour during the last 7 days preceding the census night (8-14/08/2012)? 1. Yes Go to P25 2. No P21 Why [NAME] did not work during the last 7 days (8-14/08/2012)? 0. Home worker 1. Non-worker (Never worked) 2. Non-worker (Ever worked) 3. On leave, but has job P25 4. Retired 5. Oldness 6. Student Go to P23 7. Other:.. P22 Did [NAME] do one of the following activities during the last 7 days (8-14/08/2012)? 1. Farming/Rearing animals/fishing 2. Production Go to P25 3. Services/Selling 4. House worker at someone s house 5. Home worker at own house 6. None P23 Is [NAME] available to work? 1. Yes 2. No Go to P29 P24 Has [NAME] been seeking for work during the last 7 days (8-14/08/2012)? 0. No 1. Yes, 1 st job Go to P29 2. Yes, new job FOR RESIDENTS WHO ARE CURRENTLY WORKING or HAVE EVER WORKED P25 What was [NAME] s main occupation (type of work) during the last 7 days preceding the census night or during the last time he/she worked? P26 What is [NAME] s status in employment? 1. Employee 5. Producers cooperative 2. Employer member 3. Self-employed 6. Other 4. Contributing family worker P27 What is the main product, service or activity of [NAME] s place of work? P28 What is [NAME] s institutional sector of employment? 1. Public 3. Non-profit institution 2. Private 4. Household FOR RESIDENTS AGED 12 YEARS or OLDER P29 What is [NAME] s marital status? 1. Never married 3. Separated 5. Divorced 2. Married 4. Widowed If never married and FEMALE If Widowed or Divorced If never married and MALE P32 P33 Next Person P30 How many spouses [NAME] have? (For men only) Current number of spouses: P31 What is the rank of [NAME] to the spouse? Current rank as spouse: (For women only) P32 How old was [NAME] when he/she first got married or lived together with partner? Age at first marriage : FOR RESIDENT WOMEN AGED 12 YEARS or OLDER P33 How many live births [NAME] has ever had? If none, write 00 for each sex and proceed to the next person Male Female P34 Among those children, how many are still alive? Male Female P35 How many live births has [NAME] had during the last 12 months (from 15 August 2011 to 15 August 2012)? Male Female P36 Among those children, how many are still alive? Male Female 81

100 B.2 Private households: household record and mortality record 82
101 B.3 Institutional households: person record 83
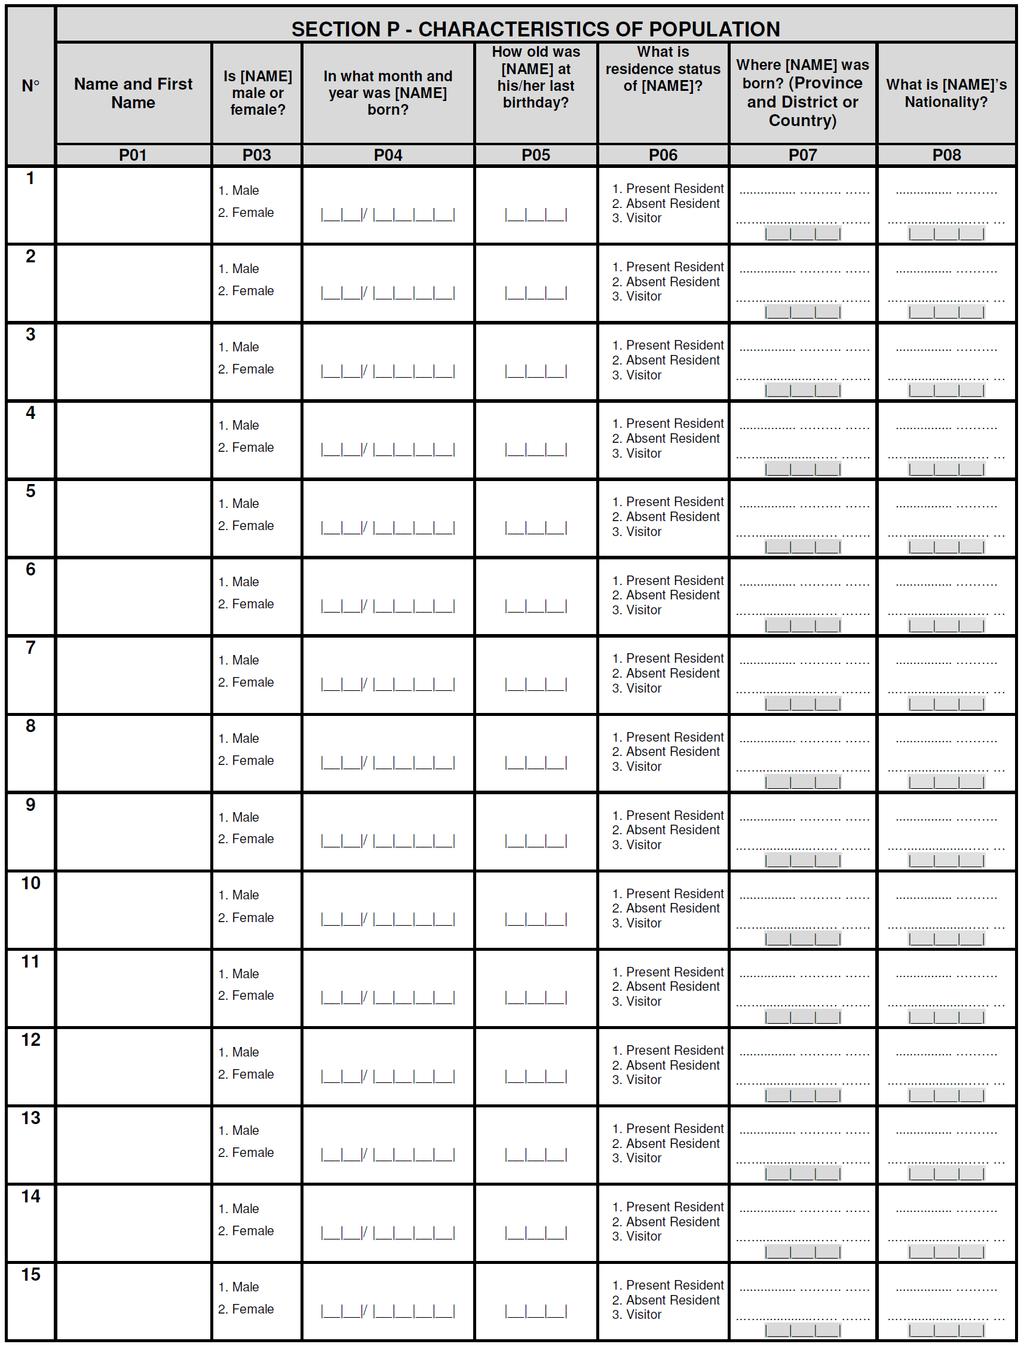
102 84
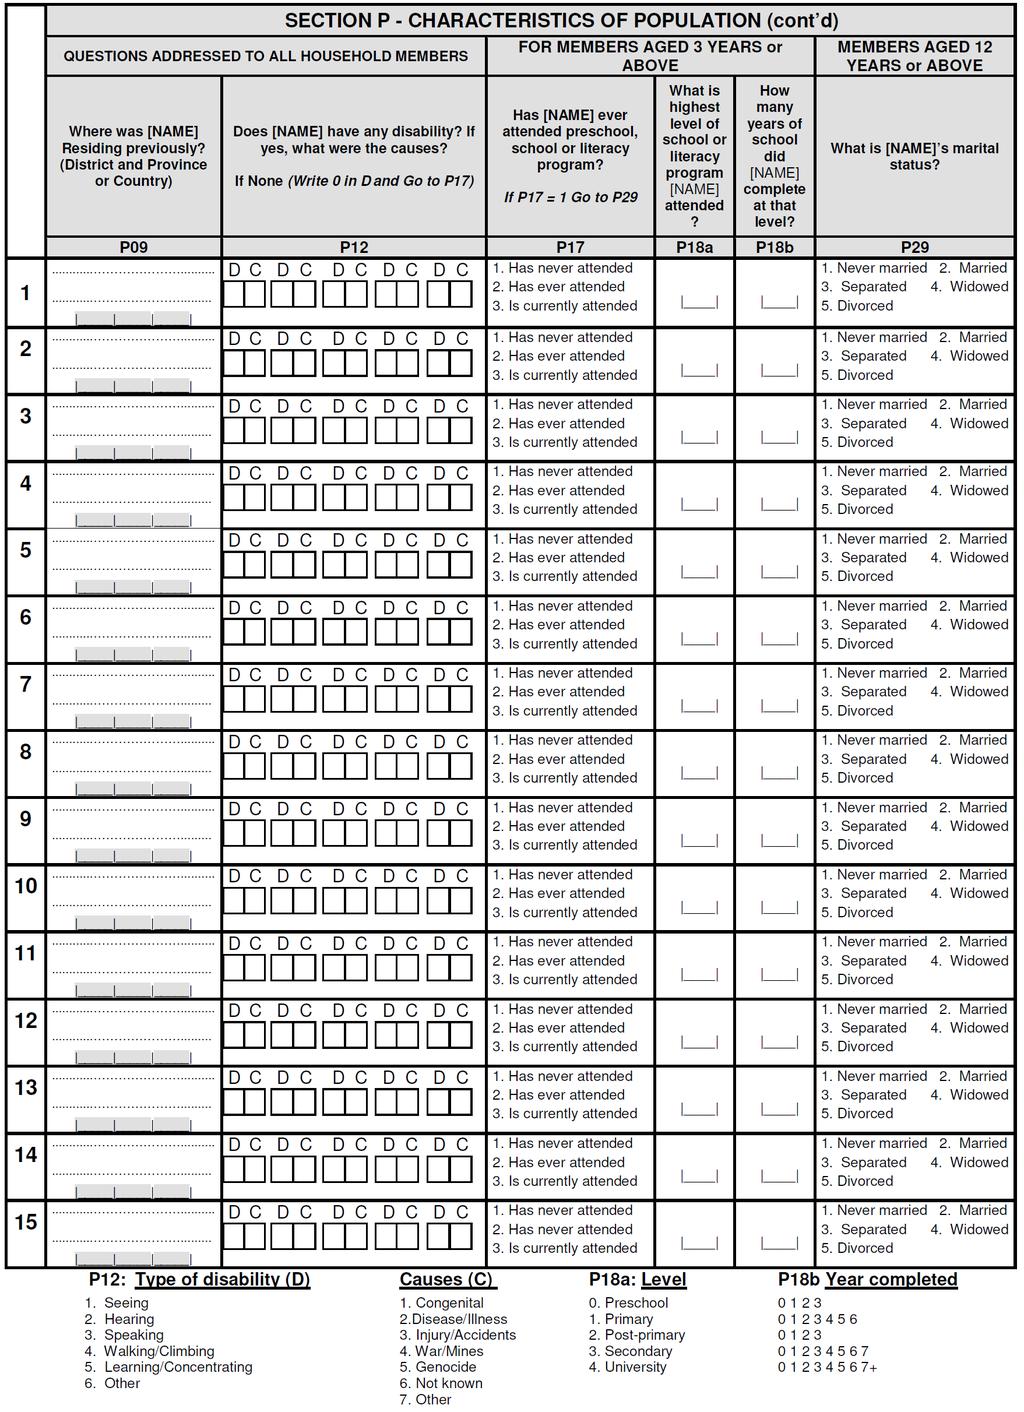
103 85
Post-Secondary Education, Training and Labour September Profile of the New Brunswick Labour Force
 Post-Secondary Education, Training and Labour September 2018 Profile of the New Brunswick Labour Force Contents Population Trends... 2 Key Labour Force Statistics... 5 New Brunswick Overview... 5 Sub-Regional
Gender institutional framework: Implications for household surveys
 GLOBAL FORUM ON GENDER STATISTICS ESA/STAT/AC.140/5.1 10-12 December 2007 English only Rome, Italy Gender institutional framework: Implications for household surveys Prepared by Cyril Parirenyatwa Central
Executive summary. Strong records of economic growth in the Asia-Pacific region have benefited many workers.
 Executive summary Strong records of economic growth in the Asia-Pacific region have benefited many workers. In many ways, these are exciting times for Asia and the Pacific as a region. Dynamic growth and
Youth labour market overview
 1 Youth labour market overview With 1.35 billion people, China has the largest population in the world and a total working age population of 937 million. For historical and political reasons, full employment
Fiscal Impacts of Immigration in 2013
 www.berl.co.nz Authors: Dr Ganesh Nana and Hugh Dixon All work is done, and services rendered at the request of, and for the purposes of the client only. Neither BERL nor any of its employees accepts any
Youth labour market overview
 1 Youth labour market overview Youth aged 15-24 account for more than 17 million of the overall 92.3 million Filipino population i. With the 25-29 age group, the young generation in the Philippines comes
QUANTITATIVE ANALYSIS OF RURAL WORKFORCE RESOURCES IN ROMANIA
 QUANTITATIVE ANALYSIS OF RURAL WORKFORCE RESOURCES IN ROMANIA Elena COFAS University of Agricultural Sciences and Veterinary Medicine of Bucharest, Romania, 59 Marasti, District 1, 011464, Bucharest, Romania,
ANALYTICAL REPORT AT NATIONAL LEVEL
 TRANSITIONAL GOVERNMENT OF ETHIOPIA OFFICE OF THE POPULATION AND HOUSING CENSUS COMMISSION THE 1984 POPULATION AND HOUSING CENSUS OF ETHIOPIA ANALYTICAL REPORT AT NATIONAL LEVEL ADDIS ABABA DECEMBER 1991
Youth labour market overview
 0 Youth labour market overview Turkey is undergoing a demographic transition. Its population comprises 74 million people and is expected to keep growing until 2050 and begin ageing in 2025 i. The share
DECENT WORK IN TANZANIA
 International Labour Office DECENT WORK IN TANZANIA What do the Decent Work Indicators tell us? INTRODUCTION Work is central to people's lives, and yet many people work in conditions that are below internationally
STRENGTHENING RURAL CANADA: Fewer & Older: The Coming Population and Demographic Challenges in Rural Newfoundland & Labrador
 STRENGTHENING RURAL CANADA: Fewer & Older: The Coming Population and Demographic Challenges in Rural Newfoundland & Labrador An Executive Summary 1 This paper has been prepared for the Strengthening Rural
Private Sector Commission
 Private Sector Commission Technical Information Bulletin No. 4 Labour Force and Employment in the Guyana Economy Private Sector Commission 157 Waterloo Street North Cummingsburg Georgetown Labour Force
Regional Disparities in Employment and Human Development in Kenya
 Regional Disparities in Employment and Human Development in Kenya Jacob Omolo 1 jackodhong@yahoo.com; omolo.jacob@ku.ac.ke ABSTRACT What are the regional disparities in employment and human development
Facilitation Tips and Handouts for Making Population Real Training Sessions
 Facilitation Tips and Handouts for Making Population Real Training Sessions The training PowerPoint presentations accompany the following handouts. Tips for facilitating each session are also provided.
YOUTH EMPLOYMENT CHALLENGES IN SUB- SAHARAN AFRICA. Ideas4Work (January, 23rd-25th, Dakar)
") YOUTH EMPLOYMENT CHALLENGES IN SUB- SAHARAN AFRICA Ideas4Work (January, 23rd-25th, Dakar) Guided by the Roadmap adopted at The Hague Global Child Labour Conference 2010 Involves the three main international
YOUTH EMPLOYMENT CHALLENGES IN SUB- SAHARAN AFRICA Ideas4Work (January, 23rd-25th, Dakar) Guided by the Roadmap adopted at The Hague Global Child Labour Conference 2010 Involves the three main international
11. Demographic Transition in Rural China:
 11. Demographic Transition in Rural China: A field survey of five provinces Funing Zhong and Jing Xiang Introduction Rural urban migration and labour mobility are major drivers of China s recent economic
HOUSEHOLD SURVEY FOR THE AFRICAN MIGRANT PROJECT: UGANDA
 HOUSEHOLD SURVEY FOR THE AFRICAN MIGRANT PROJECT: UGANDA 1. Introduction Final Survey Methodological Report In October 2009, the World Bank contracted Makerere Statistical Consult Limited to undertake
Abbreviations 2. List of Graphs, Maps, and Tables Demographic trends Marital and fertility trends 11
 CONTENTS Abbreviations 2 List of Graphs, Maps, and Tables 3 Introduction 5 1. Demographic trends 7 2. Marital and fertility trends 11 3. Literacy, education and training 20 4. Migration 25 5. Labour force
Did you sleep here last night? The impact of the household definition in sample surveys: a Tanzanian case study.
 Did you sleep here last night? The impact of the household definition in sample surveys: a Tanzanian case study. Tiziana Leone, LSE Ernestina Coast, LSE Sara Randall, UCL Abstract Household sample surveys
Overview of standards for data disaggregation
 Read me first: Overview of for data disaggregation This document gives an overview of possible and existing, thoughts and ideas on data disaggregation, as well as questions arising during the work on this
Labour Market Characteristics. Thematic Report based on Census of Population and Housing 2012
 Labour Market Characteristics Thematic Report based on Census of Population and Housing 2012 Lead Author Dr. Nisha Arunatilake BSc (Sewanee, USA) PhD (Duke, USA) Guidance and Coordination UNFPA Sri Lanka
Pursuant to Article 95 item 3 of the Constitution of Montenegro, I hereby issue the DECREE
 Pursuant to Article 95 item 3 of the Constitution of Montenegro, I hereby issue the DECREE PROMULGATING THE LAW ON OFFICIAL STATISTICS AND OFFICIAL STATISTICAL SYSTEM (Official Gazette of Montenegro 18/12
City of Surrey. Preface. Labour Force Fact Sheet
 City of Labour Force Fact Sheet Preface Statistics Canada conducts its Census of Population every five years with the most recent census having occurred in 2006. The Census provides information on the
Conference on What Africa Can Do Now To Accelerate Youth Employment. Organized by
 Conference on What Africa Can Do Now To Accelerate Youth Employment Organized by The Olusegun Obasanjo Foundation (OOF) and The African Union Commission (AUC) (Addis Ababa, 29 January 2014) Presentation
Chapter One: people & demographics
 Chapter One: people & demographics The composition of Alberta s population is the foundation for its post-secondary enrolment growth. The population s demographic profile determines the pressure points
Sri Lanka. Country coverage and the methodology of the Statistical Annex of the 2015 HDR
 Human Development Report 2015 Work for human development Briefing note for countries on the 2015 Human Development Report Sri Lanka Introduction The 2015 Human Development Report (HDR) Work for Human Development
Population Composition
 Unit-II Chapter-3 People of any country are diverse in many respects. Each person is unique in her/his own way. People can be distinguished by their age, sex and their place of residence. Some of the other
Social Profile of Oakville An Overview
 Social Profile of Oakville An Overview Prepared by Community Development Halton Funding support provided by the United Way of Oakville 2004 Community Development Halton, all rights reserved. Copies of
How to Generate Employment and Attract Investment
 How to Generate Employment and Attract Investment Beatrice Kiraso Director UNECA Subregional Office for Southern Africa 1 1. Introduction The African Economic Outlook (AEO) is an annual publication that
Poverty Profile. Executive Summary. Kingdom of Thailand
 Poverty Profile Executive Summary Kingdom of Thailand February 2001 Japan Bank for International Cooperation Chapter 1 Poverty in Thailand 1-1 Poverty Line The definition of poverty and methods for calculating
Persistent Inequality
 Canadian Centre for Policy Alternatives Ontario December 2018 Persistent Inequality Ontario s Colour-coded Labour Market Sheila Block and Grace-Edward Galabuzi www.policyalternatives.ca RESEARCH ANALYSIS
Overview of standards for data disaggregation
 Read me first: Overview of for data disaggregation This document gives an overview of possible and existing, thoughts and ideas on data disaggregation. Please note, that this document only refers to the
Mr. Ali Ahmadov Deputy Prime Minister of the Republic of Azerbaijan, Chairman of the National Coordination Council for Sustainable Development
 Mr. Ali Ahmadov Deputy Prime Minister of the Republic of Azerbaijan, Chairman of the National Coordination Council for Sustainable Development 2 Azerbaijan joined the Millennium Declaration in 2000. To
SUMMARY ANALYSIS OF KEY INDICATORS
 SUMMARY ANALYSIS OF KEY INDICATORS from the FSM 2010 Census of Population and Housing DIVISION OF STATISTICS FSM Office of Statistics, Budget, Overseas Development Assistance and Compact Management (S.B.O.C)
PROJECTING THE LABOUR SUPPLY TO 2024
 PROJECTING THE LABOUR SUPPLY TO 2024 Charles Simkins Helen Suzman Professor of Political Economy School of Economic and Business Sciences University of the Witwatersrand May 2008 centre for poverty employment
Executive summary. Part I. Major trends in wages
 Executive summary Part I. Major trends in wages Lowest wage growth globally in 2017 since 2008 Global wage growth in 2017 was not only lower than in 2016, but fell to its lowest growth rate since 2008,
Social Dimension S o ci al D im en si o n 141
 Social Dimension Social Dimension 141 142 5 th Pillar: Social Justice Fifth Pillar: Social Justice Overview of Current Situation In the framework of the Sustainable Development Strategy: Egypt 2030, social
The Informal Economy: Statistical Data and Research Findings. Country case study: South Africa
 The Informal Economy: Statistical Data and Research Findings Country case study: South Africa Contents 1. Introduction 2. The Informal Economy, National Economy, and Gender 2.1 Description of data sources
LABOUR AND EMPLOYMENT
 5 LABOUR AND EMPLOYMENT The labour force constitutes a key resource that is vital in the growth and development of countries. An overarching principle that guides interventions affecting the sector aims
DECENT WORK COUNTRY DIAGNOSTICS TECHNICAL GUIDELINES TO DRAFT THE DIAGNOSTIC REPORT
 DECENT WORK COUNTRY DIAGNOSTICS TECHNICAL GUIDELINES TO DRAFT THE DIAGNOSTIC REPORT Prepared by: Country Diagnosis Tool Team July, 2015 Table of Contents OBJECTIVE AND STRUCTURE... 1 Scope and objective...
STRENGTHENING RURAL CANADA: Fewer & Older: Population and Demographic Crossroads in Rural Saskatchewan. An Executive Summary
 STRENGTHENING RURAL CANADA: Fewer & Older: Population and Demographic Crossroads in Rural Saskatchewan An Executive Summary This paper has been prepared for the Strengthening Rural Canada initiative by:
Background Paper Series. Background Paper 2003: 3. Demographics of South African Households 1995
 Background Paper Series Background Paper 2003: 3 Demographics of South African Households 1995 Elsenburg September 2003 Overview The Provincial Decision-Making Enabling (PROVIDE) Project aims to facilitate
Hong Kong Poverty Situation Report on Ethnic Minorities 2016 Table of Contents
 Table of Contents P. i Table of Contents P. ii Table of Contents Table of Contents Page Table of Contents i List of Figures iii List of Tables v Executive Summary vi Chapter 1: Introduction 1 1.I Background
Objectives. Scope and concepts
 Resolution concerning the measurement of underemployment and inadequate employment situations, adopted by the Sixteenth International Conference of Labour Statisticians (October 1998) The Sixteenth International
ILO Global Estimates on International Migrant Workers
 ILO Global Estimates on International Migrant Workers Results and Methodology Executive Summary Labour Migration Branch Conditions of Work and Equality Department Department of Statistics ILO Global Estimates
% of Total Population
 12 2. SOCIO-ECONOMIC ANALYSIS 2.1 POPULATION The Water Services Development Plan: Demographic Report (October December 2000, WSDP) provides a detailed breakdown of population per settlement area for the
GENDER INEQUALITY IN THE WORLD OF WORK - MALAWI. Evidence from Malawi s Labour Force Survey (MLFS) 2013
 2013") GENDER INEQUALITY IN THE WORLD OF WORK - MALAWI Evidence from Malawi s Labour Force Survey (MLFS) 2013 EXECUTIVE SUMMARY The analysis provided in this report are based on key labour market indicators that
GENDER INEQUALITY IN THE WORLD OF WORK - MALAWI Evidence from Malawi s Labour Force Survey (MLFS) 2013 EXECUTIVE SUMMARY The analysis provided in this report are based on key labour market indicators that
Quarterly Labour Market Report. February 2017
 Quarterly Labour Market Report February 2017 MB14052 Feb 2017 Ministry of Business, Innovation and Employment (MBIE) Hikina Whakatutuki - Lifting to make successful MBIE develops and delivers policy, services,
Characteristics of People. The Latino population has more people under the age of 18 and fewer elderly people than the non-hispanic White population.
 The Population in the United States Population Characteristics March 1998 Issued December 1999 P20-525 Introduction This report describes the characteristics of people of or Latino origin in the United
INCREASE IN LABOR FORCE PARTICIPATION RATE AND URBANIZATION IN TAIWAN
 -133- INCREASE IN LABOR FORCE PARTICIPATION RATE AND URBANIZATION IN TAIWAN Minq-Cheno Chang* INTRODUCTION The crude activity rate in Taiwan increased rapidly from 1956 to 1969: from 28.6% to 34.9%-an
Employment, Education and Income
 This is one in a series of fact sheets that provide a profile of immigrants in. Understanding the makeup of our community is important for planning programs and services. Between 2006 and 2011, 15,465
A Socio-economic Profile of Ireland s Fishery Harbour Centres. Castletownbere
 A Socio-economic Profile of Ireland s Fishery Harbour Centres Castletownbere A report commissioned by BIM Trutz Haase* and Feline Engling May 2013 *Trutz-Hasse Social & Economic Consultants www.trutzhasse.eu
6th T.20 MEETING. Antalya, Republic of Turkey, 30 September Policy Note
 6th T.20 MEETING Antalya, Republic of Turkey, 30 September 2015 Policy Note Tourism, SMEs and Employment Policies to Stimulate Job Creation and Inclusiveness Tourism is an engine for better jobs and sustainable
Chapter 2 Overview of Sudanese Economy and the Status of ICT in Sudan
 Chapter 2 Overview of Sudanese Economy and the Status of ICT in Sudan 2.1 Introduction This chapter provides a general overview of the socio-economic characteristics of the Sudanese economy and explains
Case Study on Youth Issues: Philippines
 Case Study on Youth Issues: Philippines Introduction The Philippines has one of the largest populations of the ASEAN member states, with 105 million inhabitants, surpassed only by Indonesia. It also has
People. Population size and growth
 The social report monitors outcomes for the New Zealand population. This section provides background information on who those people are, and provides a context for the indicators that follow. People Population
Population and Dwelling Counts
 Release 1 Population and Dwelling Counts Population Counts Quick Facts In 2016, Conception Bay South had a population of 26,199, representing a percentage change of 5.4% from 2011. This compares to the
MIGRATION AND DEVELOPMENT: THE KERALA EXPERIENCE. S Irudaya Rajan K C Zachariah
 MIGRATION AND DEVELOPMENT: THE KERALA EXPERIENCE INTRODUCTION S Irudaya Rajan K C Zachariah Kerala Migration Survey (1998) estimated the number of international emigrants from Kerala at 13.6 lakh and the
ANNUAL SURVEY REPORT: BELARUS
 ANNUAL SURVEY REPORT: BELARUS 2 nd Wave (Spring 2017) OPEN Neighbourhood Communicating for a stronger partnership: connecting with citizens across the Eastern Neighbourhood June 2017 1/44 TABLE OF CONTENTS
Overview of the 2030 Agenda
 Overview of the 2030 Agenda SDG GLOBAL INDICATOR FRAMEWORK AND DECENT WORK Yacouba DIALLO, PhD Senior Statistician ILO Regional Office for Africa, Abidjan SDG Global Indicator Framework and Decent Work
Human Development Indices and Indicators: 2018 Statistical Update. Eritrea
 Human Development Indices and Indicators: 2018 Statistical Update Briefing note for countries on the 2018 Statistical Update Introduction Eritrea This briefing note is organized into ten sections. The
GENDER AND ETHNO-RACIAL INEQUALITIES IN LABOR MARKET OUTCOMES AMONG THE SECOND GENERATION IN TORONTO
 GENDER AND ETHNO-RACIAL INEQUALITIES IN LABOR MARKET OUTCOMES AMONG THE SECOND GENERATION IN TORONTO Brian Ray, University of Ottawa Valerie Preston, York University We gratefully acknowledge funding from
Global Employment Trends for Women
 December 12 Global Employment Trends for Women Executive summary International Labour Organization Geneva Global Employment Trends for Women 2012 Executive summary 1 Executive summary An analysis of five
Data on gender pay gap by education level collected by UNECE
 United Nations Working paper 18 4 March 2014 Original: English Economic Commission for Europe Conference of European Statisticians Group of Experts on Gender Statistics Work Session on Gender Statistics
24 indicators that are relevant for disaggregation Session VI: Which indicators to disaggregate by migratory status: A proposal
 SDG targets and indicators relevant to migration 10 indicators that are migration-related Session V: Brief presentations by custodian agencies 24 indicators that are relevant for disaggregation Session
Statistics Update For County Cavan
 Social Inclusion Unit November 2013 Key Figures for Cavan Population 73,183 Population change 14.3% Statistics Update For County Cavan Census 2011 Shows How Cavan is Changing Population living in 70% rural
Employment in the Informal Sector
 Chapter 2 Employment in the Sector In This Chapter The nonfarm informal sector can be defined in various ways. On the basis of available data from household surveys in Ghana, Kenya, Nigeria, Rwanda, and
BELARUS ETF COUNTRY PLAN Socioeconomic background
 BELARUS ETF COUNTRY PLAN 2007 1. Socioeconomic background Belarus is a lower middle-income country with a per capita GDP of 2,760 USD in 2005 (Atlas method GNI). The economy is highly industrialized, and
CHAPTER 4 ECONOMIC ACTIVITY OF CHILD AND YOUTH
 CHAPTER 4 ECONOMIC ACTIVITY OF CHILD AND YOUTH 4.1 DEFINITION OF CHILD AND YOUTH LABOUR Child labour is recognized as an issue to be eliminated in the world. Children s labour participation reduces their
The Government of the Republic of the Union of Myanmar Ministry of Labour, Immigration and Population Department of Labour.
 The Government of the Republic of the Union of Myanmar Ministry of Labour, Immigration and Population Department of Labour Annual Labour Force Survey-2017 Quarterly Report (1 st Quarter, January-March
Malawi Labour Force Survey 2013
 Malawi Labour Force Survey 03 i National Statistical Office Malawi Labour Force Survey 03 National Statistical Office Zomba, Malawi April 04 ii The 03 Malawi labour Force Survey was implemented by the
Poverty profile and social protection strategy for the mountainous regions of Western Nepal
 October 2014 Karnali Employment Programme Technical Assistance Poverty profile and social protection strategy for the mountainous regions of Western Nepal Policy Note Introduction This policy note presents
MIGRATION AND URBANIZATION IN VIET NAM
 GENERAL STATISTICS OFFICE THE 2014 VIET NAM INTERCENSAL POPULATION AND HOUSING SURVEY UNITED NATIONS POPULATION FUND THE 2014 VIET NAM INTERCENSAL POPULATION AND HOUSING SURVEY MIGRATION AND URBANIZATION
Data base on child labour in India: an assessment with respect to nature of data, period and uses
 Public Disclosure Authorized Public Disclosure Authorized Public Disclosure Authorized Public Disclosure Authorized Understanding Children s Work Project Working Paper Series, June 2001 1. 43860 Data base
Context Indicator 17: Population density
 3.2. Socio-economic situation of rural areas 3.2.1. Predominantly rural regions are more densely populated in the EU-N12 than in the EU-15 Context Indicator 17: Population density In 2011, predominantly
Youth and Employment in North Africa: A Regional Overview
 Youth and Employment in North Africa: A Regional Overview A Report Prepared for the Conference on Youth and Employment in North Africa Geneva, September 2017 September 2017 Contents 1. Introduction 5
The global dimension of youth employment with special focus on North Africa
 The global dimension of youth employment with special focus on North Africa Joint seminar of the European Parliament and EU Agencies 30 June 2011 1. Youth employment in ETF partner countries: an overview
Work and income SLFS 2016 in brief. The Swiss Labour Force Survey. Neuchâtel 2017
 03 Work and income 363-1600 SLFS 2016 in brief The Swiss Labour Force Survey Neuchâtel 2017 Published by: Information: Editors: Series: Topic : Original text: Translation: Layout: Graphics: Front page:
The Poor in the Indian Labour Force in the 1990s. Working Paper No. 128
 CDE September, 2004 The Poor in the Indian Labour Force in the 1990s K. SUNDARAM Email: sundaram@econdse.org SURESH D. TENDULKAR Email: suresh@econdse.org Delhi School of Economics Working Paper No. 128
CEDAW/C/2002/II/3/Add.4
 United Nations Convention on the Elimination of All Forms of Discrimination against Women CEDAW/C/2002/II/3/Add.4 Distr.: General 8 May 2002 Original: English Committee on the Elimination of Discrimination
Women in Agriculture: Some Results of Household Surveys Data Analysis 1
 Women in Agriculture: Some Results of Household Surveys Data Analysis 1 Manuel Chiriboga 2, Romain Charnay and Carol Chehab November, 2006 1 This document is part of a series of contributions by Rimisp-Latin
Disaggregating SDG indicators by migratory status. Haoyi Chen United Nations Statistics Division
 Disaggregating SDG indicators by migratory status Haoyi Chen United Nations Statistics Division Defining migratory status Step 1. Country of birth or citizenship Country of birth: foreign-born vs native
EAST AFRICAN COMMUNITY
 EAST AFRICAN COMMUNITY EAC YOUTH POLICY EAC Secretariat P.O. Box 1096 Arusha-Tanzania Tel: +255 270 4253/8 Email: eac@eachq.org Website: http://www.eac.int ACRONYMS AND ABBREVIATIONS AIDS CSOs EAC EAYC
Economic and Social Council
 United Nations Economic and Social Council Distr.: General 27 December 2001 E/CN.3/2002/27 Original: English Statistical Commission Thirty-third session 5-8 March 2002 Item 7 (f) of the provisional agenda*
Labor Based Public Works Can it be an instrument for Safety Net Strategies?
 Labor Based Public Works Can it be an instrument for Safety Net Strategies? THE GHANA PERSPECTIVE B. M. Oppong Arusha June 14, 2010 1 INTRODUCTION Safety net Strategies have been adopted by many Countries.
Low-Skill Jobs A Shrinking Share of the Rural Economy
 Low-Skill Jobs A Shrinking Share of the Rural Economy 38 Robert Gibbs rgibbs@ers.usda.gov Lorin Kusmin lkusmin@ers.usda.gov John Cromartie jbc@ers.usda.gov A signature feature of the 20th-century U.S.
International Labour Organisation. TERMS OF REFERENCE Study on working conditions of indigenous and tribal workers in the urban economy in Bangladesh
 International Labour Organisation TERMS OF REFERENCE Study on working conditions of indigenous and tribal workers in the urban economy in Bangladesh Project code Technical Backstopping Department Donor
Human Development Indices and Indicators: 2018 Statistical Update. Pakistan
 Human Development Indices and Indicators: 2018 Statistical Update Briefing note for countries on the 2018 Statistical Update Introduction Pakistan This briefing note is organized into ten sections. The
Changing Patterns of Employment and Unemployment in Africa
 UNU World Institute for Development Economics Research (UNIT/WIDER) World Development Studies 7 Changing Patterns of Employment and Unemployment in Africa A Comparative Perspective on Four Sub-Saharan
South Africa s Statement to the 48th Session of the UN Commission on Population and Development. Presented by
 South Africa s Statement to the 48th Session of the UN Commission on Population and Development Presented by Ms Bathabile Dlamini, MP Minister of Social Development Republic of South Africa New York, 13-17
Population Aging, Immigration and Future Labor Shortage : Myths and Virtual Reality
 Population Aging, Immigration and Future Labor Shortage : Myths and Virtual Reality Alain Bélanger Speakers Series of the Social Statistics Program McGill University, Montreal, January 23, 2013 Montréal,
Pulling Open the Sticky Door
 Pulling Open the Sticky Door Social Mobility among Latinos in Nebraska Lissette Aliaga-Linares Social Demographer Office of Latino/Latin American Studies (OLLAS) University of Nebraska at Omaha Overview
Venezuela (Bolivarian Republic of)
") Human Development Report 2013 The Rise of the South: Human Progress in a Diverse World Explanatory note on 2013 HDR composite indices Venezuela (Bolivarian HDI values and rank changes in the 2013 Human
Human Development Report 2013 The Rise of the South: Human Progress in a Diverse World Explanatory note on 2013 HDR composite indices Venezuela (Bolivarian HDI values and rank changes in the 2013 Human
Unemployment and underemployment data
 Helpdesk Report Unemployment and underemployment data Laura Bolton Institute of development Studies 23 November 2016 Question Identify the number (absolute and as a proportion of the working age population)
IMPROVING THE QUALITY OF DATA USED FOR INDICATORS FOR THE MILLENNIUM DEVELOPMENT GOALS AND TARGETS
 Committee for the Coordination of Statistical Activities SA/2003/17 Second session 2 September 2003 Geneva, 8-10 September 2003 Item 10(e) of the Provisional Agenda IMPROVING THE QUALITY OF DATA USED FOR
STRENGTHENING RURAL CANADA: Fewer & Older: The Coming Demographic Crisis in Rural Ontario
 STRENGTHENING RURAL CANADA: Fewer & Older: The Coming Demographic Crisis in Rural Ontario An Executive Summary 1 This paper has been prepared for the Strengthening Rural Canada initiative by: Dr. Bakhtiar
Defining migratory status in the context of the 2030 Agenda
 Defining migratory status in the context of the 2030 Agenda Haoyi Chen United Nations Statistics Division UN Expert Group Meeting on Improving Migration Data in the context of the 2020 Agenda 20-22 June
Issues Paper. Civil registration and vital statistics and the demographic dividend
 Fourth Conference of African Ministers Responsible for Civil Registration 4-8 December 2017 Nouakchott AUC/CRMC4/2017/13 Issues Paper Civil registration and vital statistics and the demographic dividend
Importance of labour migration data for policy-making- Updates
 Importance of labour migration data for policy-making- Updates Tite Habiyakare ILO Regional Office for Asia and the Pacific July 2015 ILO Department of Statistics Overview From international legal instruments
Children, education and migration: Win-win policy responses for codevelopment
 OPEN ACCESS University of Houston and UNICEF Family, Migration & Dignity Special Issue Children, education and migration: Win-win policy responses for codevelopment Jeronimo Cortina ABSTRACT Among the