Comment Mining, Popularity Prediction, and Social Network Analysis
|
|
|
- Bernadette Collins
- 6 years ago
- Views:
Transcription
1 Comment Mining, Popularity Prediction, and Social Network Analysis A thesis submitted in partial fulfillment of the requirements for the degree of Master of Science at George Mason University By Salman Jamali Bachelor of Science FAST - National University of Computer & Emerging Sciences, 2006 Director: Huzefa Rangwala, Assistant Professor Department of Computer Science Spring Semester 2010 George Mason University Fairfax, VA
2 ACKNOWLEDGEMENTS First and foremost, I would like to thank Allah Almighty for all of His blessings, and for making my life beautiful and bountiful. I beg for His mercy, I seek His protection, and I submit to His will. May He be with all of us in the most difficult times to come. I am deeply indebted to my advisor, Dr. Huzefa Rangwala. His constant guidance, persistence, support, insightful feedback, constructive critique, and mentoring has been invaluable. I would not have envisaged a more dedicated mentor, where I relied on his expertise for a solid research direction, research writing etiquette, my deepest debugging troubles, and beyond. Many thanks to Dr. Angelos Stavrou and Dr. Daniel Barbará for the time and effort they spent reviewing my research and the helpful comments they contributed to the success of this thesis. I am grateful to Dr. Gheorghe Tecuci and Dr. Mihai Boicu for dedicatedly mentoring me and helping me to exploit my research potential. I express my deepest gratitude to my parents for their extraordinary and lively encouragement. This dissertation was simply impossible without the continuous support, love, and kindness of my sister, Maria Jamali, and my dearest friend and brother-in-law, Hamza Ahmad. I cannot list all of my friends, and I simply cannot thank them enough even for just being my friends. For as long as I live, I wish to be with them in our happiest and saddest moments of life. ii
3 TABLE OF CONTENTS Page List of Tables...v List of Figures... vi Abstract... vii Chapter 1: Introduction Motivation Problem Hypothesis Contributions Thesis Outline...5 Chapter 2 : Background Social Networks Implicit versus Explicit Social Network Formations Social Network Analysis versus Dynamic Network Analysis Related Research Social Bookmarking and Digg Network...11 Chapter 3: User Characterization Network Description and Statistics Degree Distribution Egonet Analysis User Membership Analysis...23 Chapter 4: Comparative Analysis of Network Formations Introduction Network Properties Experimental Results Discussion...34 Chapter 5: Popularity Prediction of Online Content Introduction Prediction Methods Feature Description...38 iii
4 5.4. Results and Discussion...41 Chapter 6: Opinion Mining Introduction Related Work SentiWordNet Method Feature Description Classification Results Discussion...54 Chapter 7: Timed Egonets Tracing Periodicity Introduction Process Results and Discussion...59 Chapter 8: Applications The Digg Effect Evolution of Opinions...69 Chapter 9: Conclusion and Future Directions...73 Appendices...76 A.1 Digg Dataset Crawler...76 A.2 XML for Digg Story...82 References...86 iv
5 LIST OF TABLES Table Page Table 1.1: Ranking of social bookmarking services by EBizMBA... 3 Table 2.1: Digg Dataset Statistics...12 Table 4.3: Social network statistics for co-participation and reply-answer network...32 Table 5.1: Performance for Digg-Score Prediction (Ten hours data only)...41 Table 5.2: Performance for Digg-Score Prediction (Fifteen hours data only)...41 Table 5.3: Performance for Digg-Score Prediction (All data)...42 Table 6.1: Prediction Results with Sentiment Features...52 Table 6.2: Prediction Results without Sentiment Features...52 Table 7.1: Classification of Digg stories into constant sized bins...58 Table 8.3: Product popularity comparison based on summarized sentiments...71 v
6 LIST OF FIGURES Figure Page Figure 3.1: Distribution of Degree (Log Scale)...16 Figure 3.2: Egonets...18 Figure 3.3: Distribution of the ratio of within-category to the overall degree...21 Figure 3.4: Distribution of the ratio of within-topic to the overall degree...22 Figure 3.5: Hierarchical Entropy Distribution: User Entropy versus # of Users...24 Figure 4.1: A typical comment thread...26 Figure 4.2: Resultant reply network from the comment thread...26 Figure 6.3: Reply-network s edge between two users...54 Figure 7.2: Average Degree for the 16 most active users in two month periods...59 Figure 7.3: Timed Egonets...62 Figure 8.1: Unique visits per hour Normal behavior without Digg Effect...66 Figure 8.2: Unique visits per hour Slashdotted behavior with Digg Effect...67 vi
7 ABSTRACT COMMENT MINING, POPULARITY PREDICTION, AND SOCIAL NETWORK ANALYSIS Salman Jamali, MS George Mason University, 2010 Thesis Director: Huzefa Rangwala With the growing number of online collaborative news aggregator social websites, we witness thousands of comments posted by the internet community on individual news items shared on such networks. We started out with an objective to exhaustively analyze these comments for extracting insightful information about their various collective aspects. For our study, we worked with the data of one of the most popular news aggregator websites, called Digg 1. Using Egonet analysis for projecting local neighborhoods, we identified the characteristics of highly active individual users with and without time constraints. The time-based egonets effectively improved our ability to visualize variations in user activity patterns. We proposed a framework to apply data mining techniques to these comments (and comment threads), which helped us in predicting the popularity of news stories. We reported a very small loss of % in 1
8 multiclass classification accuracy while predicting the popularity score using the first few hours of comment data in comparison to all the available comment data. We found that Digg community was highly active in posting comments and found their focus to be spread across a wide range of topics. We also performed a comparative analysis of two network formations: co-participation and reply-answer. This helped us in comparing these implicit networks that we derived with characteristic attributes of social networks. Further, we conducted preliminary experiments to improve the strength of a link in our co-participation network by analyzing the positive, negative or neutral sentiments expressed by users in their commentaries. One important application of our work lies in a provision of unique and rich information to advertisers enabling them to target certain commenters as potential customers. Our framework can also be tweaked to forewarn web administrators against a potential Digg Effect (Section 8.1).
9 CHAPTER 1: INTRODUCTION The past decade has seen a massive rise in web services and applications that allow users to create, collaborate, and share varied forms of data like articles (web-blogs), pictures (Flickr 2 ), video (Youtube 3 ), and status updates (Twitter 4 ). Social bookmarking websites like Delicious 5, Slashdot 6, and Digg allow users to submit links to web content they find interesting along with a short description. Every user in these online communities can initiate or contribute to an ongoing discussion by providing comments for the posted content, and also rate the articles that they find interesting. Thus, social bookmarking sites serve as data aggregators, web-based discussion forums, and an online collaborative filtering system that can collectively determine popular online content. Recently, there have been several studies [1], [2], [3] that have analyzed social networks generated from comment interaction between users. In this work we model a co-participation network similar to the co-authorship and citation networks [4], [5] where users are linked together if they comment on the same discussion thread or submitted story. This implicit relationship between users based on comment information provides an understanding of the complex underlying community structure. We use egonets [6] to
10 capture the local neighborhoods of users within the derived social network, and provide an understanding of the community with multiple interests. We further extract several user-based and comment-based features, and train classification and regression models for predicting popular stories. We evaluate our methods to use features derived from comments that were posted within the first few hours of posting the story. Successful prediction of popular content allows users to sift through the vast amount of available online data and can also aid in the ranking algorithms pursued by social bookmarking websites. For our analysis, we use Digg, a popular social bookmarking website that allows users to share comment, and rate on diverse online available information. Digg was founded in 2004 by Kevin Rose 7. We found that the user community within Digg was highly active in posting comments and found their focus to be spread across a wide range of topics ranging from world business to entertainment. We also showed the ability to predict the popularity index using early available comment and user based features. We continued our analysis and explored two related areas: Dynamic Network Analysis and Semantic Analysis. The experiments, results and discussions pertaining to these studies are present in chapter 5 and Motivation Enormous amount of opinions and beliefs are being shared in online communities on a daily basis. This content provides useful information to marketers, policy makers, intelligence agencies, and election candidates. When people claim responsibility against a 7 2
11 comment that they make on some internet community, they take great care in picking the best words for expressing themselves. They end up sharing ideas, which are valuable for people who conduct analysis in the respective domains. The very same people are responsible on behalf of their companies to make sure that the image of their object of interest is never spoiled. Further, it s essential that the internet community takes interest in their products, slogans, and/or objectives. To assess the popularity that follows a certain news item about anything, fortunately, there is a new platform that can be utilized (ironically, manipulated 8 ), called Social Bookmarking. Table 1.1 is a list of top 10 Social bookmarking services as per the criteria defined in [7]: Table Ranking of social bookmarking services by EBizMBA Rank Service Inbound Links Monthly Visitors Alexa Rank 1 Twitter 760,750,806 23,579, Digg 383,598,000 33,433, Yahoo! Buzz 20,031,000 8,119,906 NA 4 tweetmeme 422,863 18,244,542 1,898 5 StumbleUpon 234,000,000 4,418, Reddit 161,685,000 4,908, technorati 175,287,000 3,309, del.icio.us 427,665,000 1,623,083 2,476 9 kaboodle 2,600,000 3,941,212 1, Mix 16,005, ,
12 Millions of comments are posted against the news stories, which are linked on these services. Just taking a glimpse at all the comments that are posted for some topics of interest in some particular time-slot is beyond the scope of manual analysis. Now considering the importance of this wealth of commentary that we discussed earlier, it was surprising to notice inconsiderate research focus on this topic. The most relevant research pertaining to our work was related to the analysis of Yahoo Questions & Answers [1] dataset and Slashdot news forum [2]. Essentially, we were interested in techniques and methods that could summarize few opinions in a way that would be helpful in forecasting the future and planning ahead of time. The forecast and planning could be for any object, be it a product, person, organization. We built a prediction model using standard classification and regression algorithms for predicting the popularity of links that were shared on Digg. We show promising results for predicting the popularity scores even after limiting our feature extraction to the first few hours of comment activity that follows a Digg submission. The results are evident of the usability of our framework Problem Hypothesis There is a lot of opportunity in mining user comments, and harnessing the hidden structures in comment threads. An exhaustive analysis of such co-participation networks and/or reply-answer networks in static and dynamic setting would significantly help in studying diffusion of information, identifying hidden communities, tracing the evolution of communities, and in extracting insightful information in terms of user sentiments. 4
13 1.3. Contributions Popularity prediction of online content with limited visibility of events, and Insightful user characterization based on what, when, how, and where users comment against some online content. Publication: Digging Digg: Comment Mining, Popularity Prediction, and Social Network Analysis [79], which was published by IEEE for WISM 09-AICI Thesis Outline This thesis is divided into following 10 chapters: Chapter 2 provides the background information on the essential concepts used throughout the thesis. In Chapter 3, we provide discussions on the various experiments conducted for characterizing users. In chapter 4, we provide a description of our prediction model, the experiments we conducted, and a discussion of the results. Chapter 5 presents the preliminary experimentation we performed to quantify semantics of user comments. In Chapter 6, a comparative analysis of two network formations: co-participation and reply-answer, is discussed. Chapter 7 explains that evolution of user behavior captured using Timed Egonets. In chapter 8, we present two important future applications of our study. Finally, chapter 10 concludes the thesis and suggests some directions for future research. 5
14 CHAPTER 2: BACKGROUND 2.1. Social Networks A network is a set of items called vertices or nodes, with connections between them called edges [8]. Such a network is the simplest form and more complex networks can be formulated with different types of nodes, and edges. Numerous systems around the world can be represented as networks, for e.g. network of friend-to-friend connections [9], or business-to-business connections [10, 11, 12], protein networks [13], the World Wide Web, network of paper citations [81], and networks [80]. With the advancement in performance and storage capacity of computers, nowadays, we can analyze networks containing millions of nodes and edges. Consequently, the research methods pertaining to network analysis are now directed towards exploring and answering the same questions using commonly available network analysis tools. In [14], networks from different branches of science were compared and the commonalities were highlighted. One of the types of network explored was Social Network. A social network is defined between persons or groups of persons with some pattern of interactions or connections amongst them [15, 16]. Traditionally, analysis of these social networks has suffered from limited capabilities of resources and small sample sizes. Surveys and interviews were conducted 6
15 in hope of collecting data but all such approaches were labor intensive. [17] provides a review of the issues that were faced in early social network analysis. When these problems were overcome, it resulted in network analysis of well-documented and reliable networks, like actor-to-actor network using IMDB database [82], friend-to-friend network [9], reply-network [2], and Question Answer network [1] Implicit versus Explicit Social Network Formations Each collection of objects that is used to formulate a social network carries certain features and limitations with it. Networks like Facebook 9, Orkut 10, and Linkedin 11, have one limitation in common every user must be an explicitly defined social contact of any other network user in order to interact using the relative service s facilities and for sharing interests with him or her. Contrary to this, paper citation networks, coparticipation networks [1, 2], and other such networks do not restrict interactivity and hence, people assume hidden, also called implicit links amongst themselves by following each other in respective ways. Such linkages can also be called implicitly defined social contacts [2]. So, although in a network of implicit edges, people might not be close or real-world friends, but, they share something in common, and most probably it s the opinions on topics of shared interests [18, 19]. In this research, we have extracted implicit networks from the dataset of a social bookmarking service, known as Digg
16 2.3. Social Network Analysis versus Dynamic Network Analysis In Social Network Analysis, ideas derived from graph theory are applied to a social network for studying the underlying relationships. In contemporary research, the term SNA refers to analysis of any network where nodes are of one or two types only [20]. Therefore, the SNA tools are effective across many domains of networks regardless of the nature of nodes. Typical analysis of social networks is conducted in a static setting, which means that irrespective of time, all of the available edges and nodes are consumed in forming the social network. However, extraction of communities, clustering of nodes, tracing diffusion of information, and statistical analysis of a network can be done in a dynamic setting as well [21, 22, 23]. Social user groups or communities evolve over time and the evolution can be traced if we split the social network across a sequence of time slots. Such a study can result in insightful suggestions about the behavior of individual nodes, the influence of certain nodes on other nodes, and the diffusion of information. The application of this information is highly valued in epidemiology (e.g. tracing pandemic viruses) and viral marketing (e.g. propagation of an idea of innovation). NAACSOS 12 define Dynamic Network Analysis as follows: Dynamic Network Analysis (DNA) varies from traditional social network analysis in that it can handle large dynamic multi-mode, multi-link networks with varying levels of uncertainty. DNA, like quantum mechanics, is a theory in which relations are probabilistic, acts of measurement change the network, and movement in one part of a network propagates through the
17 entire system. Network properties change over time and the actors can drift from one behavior, rank or opinion to next [20]. There is a lot of research interest in DNA and few interesting frameworks were developed for such analysis [21, 22, 23, and 24]. In this thesis, we have tried to visualize and describe behavioral changes adapted by Digg users over time. We introduced a concept of Timed Egonets where for each of the active commenters, we generated different mutually exclusive egonets in a sequence defined by 8 time bins. Chapter 7 provides a complete description of the method, experiments and results pertaining to timed egonets Related Research USENET was one of the first web based message forum developed in 1979 and has seen several works related to development of tools for visualizing the structure of the discussions within these forums [75]. Statistical analysis methods [76] and network analysis [77] methods were developed to understand the characteristics of the different discussion forums. Recently, researchers have used comment information to define implicit relationships between users, and then used social network analysis methods to understand the characteristics and interaction patterns of several communities and groups [3], [78]. Implicit relationships or links are defined between users who comment or reply on discussion threads to a particular user [3]. Within the context of individual web-blogs, a relationship was defined between the author of the blog and the commenter [78]. 9
18 Our work is closely related to the analysis of the community participating in the Yahoo Question and Answer forum (Yahoo QA) [1]. In case of the Yahoo QA forum a user posts a question and several users provide an answer which are rated by the community. The work analyzed the interaction patterns between the various users belonging to multiple categories. An interaction or relationship was defined as a directed edge between the user who initiated a question and the users who replied with an answer. Using egonets [6] to characterize the local neighborhood of users within the derived social network, differences in the interaction patterns between users belonging to the technical and advice forums was observed. In our work, we define a weaker undirected interaction between two users who comment on the same story. Recently, a social network was modeled [2] for the user community in Slashdot (another online bookmarking site). The implicit relationship was defined similar to the reply-answer network above, where an edge was defined between users who would comment directly to posted comments. Thus, if user A posts a comment, and user B replies to the comment, a relationship exists between users A and B. However, if a user C comments to the story but not to A s comment then there exists no relation between user A and C. Our definition of the implicit relationship between user follows the more traditional definition in co-authorship network [4], [5] and will results in relationships between the three users A, B, and C in the above example. 10
19 2.5. Social Bookmarking and Digg Network The Federal Depository Library Program (FDLP 13 ) defines Social Bookmarking as follows: A Web-based service where users can create and store links. It is an increasingly popular way to locate, classify, rank, and share internet resources. While Web browsers have the ability to bookmark pages, those links are tied to that browser/computer. Social Bookmarking, on the other hand, is tied to an online account, which can be publicly or privately accessible. Based on the viewing properties and tags/categorization, these bookmarks can be shared and discovered by others. It is a way to share news, sites, and much more with a broader audience. Digg is one of the most active social bookmarking website where registered users submit news articles, videos, and images along with an optional short description. Submissions can lead to a discussion amongst the registered users who may post a series of comments regarding the material posted. A registered Digg user can rate the submissions (referred to as stories in this work), and support the stories that they find interesting by providing a positive rating referred to as a digg. On the other hand users can also provide negative rating known as a bury. Using the collaborative effort of millions of registered users, stories get rated to have a Digg-score, which is defined as Digg-score serves as a popularity index. The exact algorithm that decides which stories would show up on the front page of Digg website is not revealed, but stories that
20 achieve a high Digg-score from a diverse group of users are, almost always, promoted to the popular section of Digg [25]. Table Digg Dataset Statistics Category S U M C/S World & Business Technology Offbeat Entertainment Science Lifestyle Gaming Sports In Table 2.1, S denotes the total number of stories within the categories. U indicates the total number of users who commented at least once for the stories within the categories. M indicates the total number of users assigned to the categories (members). C/S denotes the average number of comments per story within the category. Users also have the option to provide a rating for the individual comments. A positive rating for a comment is an up score whereas a negative rating is a down score. We used the Digg API to crawl 37,185 popular stories from November 16, 2007 to March 10, The total number of comments in our dataset is 6,188,266, and the total number of users who posted at least one comment is 253,846. The Digg-score for the 12
21 crawled stories ranged from 86 to 37,947 with a mean of 1,204 and a standard deviation of 1,122. The average number of comment made by a user is 24. As shown in Table 2.1, stories at Digg are classified hierarchically into two levels, namely eight categories and 51 topics (not shown in Table 2.1) within the different categories. The eight categories include 1. World Business, 2. Technology, 3. Science, 4. Gaming, 5. Sports, 6. Entertainment, 7. Life Style, and 8. Offbeat. There were a total of 51 topics when we crawled the data. Examples of topics include Apple, Microsoft, and Linux within Technology, Football and Basketball within Sports, and 2008 US Elections (one of the most popular topic) within World Business. At the time of this writing however the topic 2008 US Elections was no longer present. Table 2.1 provides general statistics about the dataset divided across the eight categories. The table shows the number of stories (S), total number of users who at least commented (U) once, and the average number of comments per story within the eight categories. 13
22 We also assign a user membership to one of the eight categories. This is done by assigning the user the category where he/she comments the most. In Table 2.1, we report the total members per category (M). We similarly assign a user to belong to one of the topics within the categories. From columns U and M we notice that there is a large overlap in the categories that users comment. 14
23 CHAPTER 3: USER CHARACTERIZATION Motivated by the work involved with co-authorship and citation networks [26], [27] we define a co-participation network to model the relationships between different users in the Digg community Network Description and Statistics An undirected graph G = (V, E) is used to represent the co-participation network. The set of vertices V represent the set of users commenting across the different stories. The sets of edges E represent the interaction between the different users, and an edge E i,j exists between users V i and V j if the pair of users co-participate by commenting on n or more stories. We experimented with the threshold parameter n used to define the presence or absence of an edge or relationships between users. The average degree (i.e., number of edges per node) was , 114.4, and 26.8 for threshold values of n equal to 1, 4, and 8, respectively. For the results reported here we use a threshold value of n = 4 i.e., a pair of users are considered to be connected if they both comment on at least four different stories. A pair of users commenting on the same story may have differing or even opposing views. In the future (refer to chapter 5), we aim to refine our relationship definition between the users based on the polarity of the comments i.e., perform 15
![sentiment analysis or opinion mining [28], [29] using text information of the comment. 3.2. Degree Distribution Figure 3.1 - Distribution of degree (Log Scale) In Figure 3.](/docs-images/75/72288757/images/24-0.jpg "1 we present the cumulative distribution (CDF) of the degrees per user separated based on membership to one of the eight categories.")
24 sentiment analysis or opinion mining [28], [29] using text information of the comment Degree Distribution Figure Distribution of degree (Log Scale) In Figure 3.1 we present the cumulative distribution (CDF) of the degrees per user separated based on membership to one of the eight categories. Nodes with more degrees indicate the user participating with several other users. From this graph, we observe the difference between the users in the eight categories. The degree is plotted using a logarithmic scale and indicates a heavy tailed distribution, referring to the high levels of co-participation activity for the various categories. The category World & Business shows the highest participation amongst the 16
25 users as seen from the CDF plot. This is primarily because of the high level of activity in terms of posting stories, and discussions due to the 2008 US Presidential Elections (a topic under World & Business), a popular topic when we downloaded the data. We can also see the differences between the other categories. A user was assigned a category membership based on the category in which he/she would post the maximum comments. A user was free to comment across various categories, and though we compute the degree per user and analyze by category, we do not restrict the neighbors to be in the same topic or category Egonet Analysis One technique to visualize the local neighborhood of individual users is by using Egonets. We also use egonet analysis to understand the relationships amongst different users within the different categories. Such an egonet analysis was done previously [1, 30] to differentiate between community of users that were discussion prone or not. A one level egonet for a user is defined as the user, the set of users who interact directly with the user (neighbors), and the relationships between those users. We can extend the definition of egonet to have neighbors who are N hops (links) away from the user in consideration. 17
26 18
 World & Business, (b) Technology, (c) Offbeat, (d) Entertainment, (e) Science, (f)")
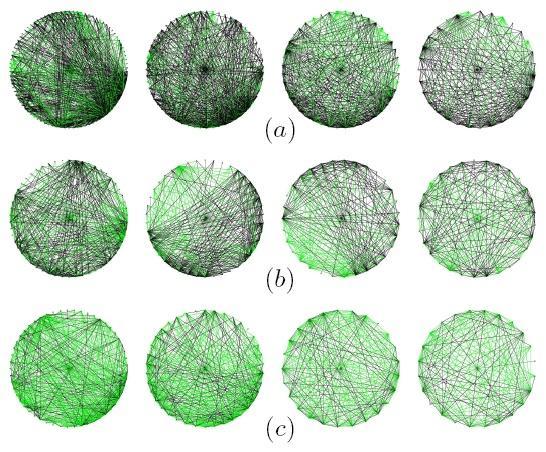
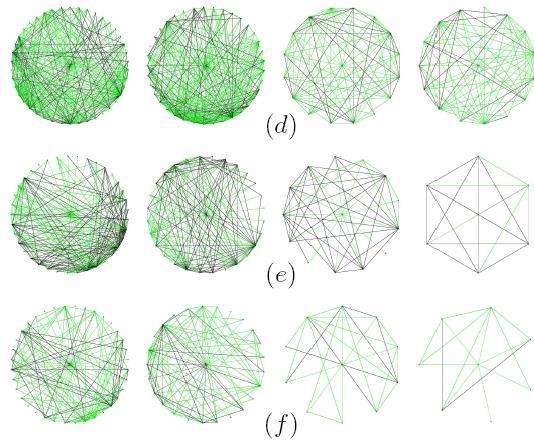
27 Figure Egonets In Figure 3.2, each row from left to right shows egonets for 1st, 20th, 80th, and 100th most active users in Categories: (a) World & Business, (b) Technology, (c) Offbeat, (d) Entertainment, (e) Science, (f) Life Style, (g) Gaming, and (h) Sports. We show the egonets for a set of four active users within each of the eight categories. For each category we identify the most active users, i.e., users who have commented the most on stories posted within a particular category. Figure 3.2 shows only the 1st, 20th, 80th, and 100th most active users per category. We have up to 200 egonets per category at the project website The egonets we present have a two color coding scheme where a co-participation edge E i,j is colored black if both V i and V j have the same category membership, whereas edge V i and V j is colored green if users V i and V j belong to different categories. 19
28 Analyzing these egonets helped us to differentiate between users based on their focus and participation level. If the egonet is very dense, it infers that the user in consideration has many neighbors, and/or these neighbors are highly connected amongst each other. By analyzing the color density we can infer two things based on the two colors that we used. A blackish egonet means that many of the neighbors belong to the same category as the category of the user in consideration; hence he can be categorized as focused user. A greenish Egonet on the other hand implies that the user is not focused because the neighbors belong to different categories. So, we can say that a blackish dense egonet represents a highly active and focused user as compared to a blackish sparse egonet, which will be moderately active and focused user. Whereas a greenish dense egonet would represent a highly active but unfocused user; and, a greenish sparse egonet belongs to a moderately active and unfocused user. We have ordered the categories from top to bottom in decreasing order of the densities of egonets. The egonets of users in categories like Sports, Gaming, and Life Style (Figure 3.2 (f)-(h)) have smaller and less denser neighborhood in comparison to categories like World Business, Technology, and Offbeat (Figure 3.2 (a)-(c)). The dense nature of egonets for the World Business category can be explained by the large number of stories that became popular due to the 2008 US Elections. From this data we can also infer that within the Digg community stories within the Sports and Gaming categories do not lead to large user interaction and discussion. 20
) show more black edges in comparison to the corresponding egonets for the Offbeat category (Figure 3.2(c)).")
29 The egonets also suggests that users within Technology participate by way of commenting in much larger volumes in comparison to Science. The egonets for the World Business category (Figure 3.2(a)) show more black edges in comparison to the corresponding egonets for the Offbeat category (Figure 3.2(c)). This suggests that the World Business community users are focused and involved with discussing stories that are posted in that category. The Offbeat category is a collection of diverse topics (e.g., comedy, pets ) that do not fit within the other seven categories. As such it is expected that users within the Offbeat category are loosely coupled i.e., not focused to comment in the same categories as their category membership indicates. We observe that users in the Offbeat category also comment on stories posted in the Life Style and Entertainment categories. Figure Distribution of the ratio of within-category degree to the overall degree 21
 to the overall degree.")
30 Figure Distribution of the ratio of within-topic to the overall degree In Figure 3.3 we show the cumulative distribution function for that ratio of incategory degree (or within-category) to the overall degree. The in-category degree for a node is the number of one-hop neighbors who have the same membership as the user in consideration. The Figure 3.3 provides complementary results to the ones observed for the hundred most active users seen in the egonet analysis by allowing us to see the percentage of users below a specific value of the in-category ratio. In Figure 3.4 we show the cumulative distribution for the ratio of the in-topic degree to the overall degree corresponding to five selected topics within the eight categories. It is interesting to see that the users who comment within 2008 US Elections topic are highly topic-focused in comparison to the Finance topics, both within the World Business category. The Technology topics Apple and Linux 22
31 also have a high degree of in-topic focus. In both the Figures 3.3 and 3.4 we neglect users having an overall degree of zero. This does not have an effect on the trends observed and allows us to focus on the users with at least a single neighbor User Membership Analysis As discussed in the previous section, users within the Digg community have overlapping interests and as such participate and comment across multiple areas of interest. As done previously [1], we computed an entropy measure to capture the focus of the user. Users commenting within a large number of categories in comparison to a user commenting across a fewer number of categories would have higher entropy and less focus. As such, we can define the entropy for the user with respect to the categories as where i iterates over the eight categories and pi denotes the probability for the user to belong to category i. Similarly, we can compute an entropy measure for the user with respect to the 51 topics given by The sum of the H 1 and H 2 represents the total hierarchical entropy for a user. Using such a two level hierarchical entropy definition allows us to differentiate between users who would comment on a diverse set of subcategories within a single category (less entropy because H 1 will be low) and users who would comment on a diverse set of subcategories spread across multiple categories (higher entropy because H 1 will be high). 23
32 Figure Hierarchical Entropy Distribution: User Entropy (X) versus Number of Users (Y) In Figure 3.5 we show the hierarchical entropy distribution for the 70,753 users who commented at least ten times and 27,645 users who commented at least forty times. Computing the entropies for users who comment very few times would bias the analysis (entropy for a user who comments once will be zero). A high percentage of users have a higher entropy i.e., in between and for users that commented at least 10 times and 40 times, respectively. It can be inferred that users have a tendency to participate and comment across multiple discussion topics. This suggests that the user community in Digg is not very focused but this could be due to loosely defined categories and subcategories (called topics). We also use the entropy measures of a comment author as features for predicting the popularity of a story. 24
33 CHAPTER 4: COMPARATIVE ANALYSIS OF NETWORK FORMATIONS 4.1. Introduction In all the experiments that we conducted by far, the underlying social network formation was based on the principle of co-participation. As we discussed earlier, in our Digg co-participation network, two users are connected if they both comment on X number of similar stories. The density of such a network is indirectly proportional to this number X: Such a formation assumes that it s not a coincidence for any two random users to co-comment on a relevant number of stories, that is, such a behavior is indicator of existence of a common interest. Essentially, researchers try to capture links that are truly representative of common interests and opinions. [2] suggests that there are other ways to model a social network out of comment threads. One important formation relies on replies received by comments from other commenters. If we model a link against each reply, the resulting network can be called Reply-Network. In Figure 4.1 and 4.2, we show a miniature example to illustrate the generation of a reply-answer network from a sample comment thread. 25

34 Figure A typical comment thread. Figure Resultant Reply Network from the above comment thread 26
35 Figure 4.1 is an arbitrary comment thread representative of typical scenarios of commentaries on social bookmarks. The root node is the story itself, and each of the other nodes represents a comment. Each comment is tagged by an alphabet that s the username of the commenter. Figure 4.2 is the corresponding general reply network for this thread. Note here that this reply network is unconditional - one simple reply by X to Y results in one link whose weight is ignored here for the sake of simplicity. There can be a number of variations of a reply network based on how we determine the weight of the links. The more restrictive it is, the less dense the network becomes. The corresponding co-participation network, being unconditional with coparticipation threshold equal to 1, isn t shown here. It will be no different than a complete graph where there is a link b/w every pair of commenters because they all commented on story S. So, the very first obvious difference between a reply network and a coparticipation network emerges out to be the density of the network. We performed an exhaustive comparative analysis of the reply networks in [2], Digg s co-participation network, and a Digg reply network. Indicators of this analysis are essentially certain network properties that are critically important in any sort of social network analysis. The first step to exploring a social network is to identify the information that s of interest to the researcher. As we discussed earlier, different formations tend to reveal varying insights from the same social network data. Comment threads, if merged together, result in a collaboration network where we can claim that the purpose of collaboration is to democratically decide the popularity of the news item. 27
36 In this section, we have done a rough comparative analysis to see if there are other ways in which our Digg network could have been modeled. Real networks tend to differ from Random Networks. This was studied in depth by Rapport [55, 56], and it indicates that we can manipulate some network properties in to improve our real networks. Further, this exploitation guides the formation of networks. Contemporary research on networks focus on a limited set of network properties, which are universally computable and applicable; for e.g., small world effect [14, 57], clustering or network transitivity [14], community structure [59, 60, 61], degree distribution [62, 63], and spectral properties [64, 65, 66] Network Properties For many networks, following are few important properties that are important for their characterization. Number of Nodes For the same network data, this number, varies based on network formation and the filters that are applied to the data. Whether the network constitutes of directed or undirected edges, relies on edge weight threshold or not, considers anonymous nodes (users) or not; all such aspects are primary factors that affect this number. Number of Edges Denoted by 28
37 this number is controlled and contributes to density of the network. Typically, an undirected network has a larger number of edges as compared to a directed network; whereas, a network with no edge weight threshold will be denser as compared to a network where all edges below a certain edge weight are ignored. Maximum Cluster Size The compactness of the community inherent in the network can be derived by this number. The more compact a network is, the more typical it is as a social network. In such networks, the rate of flow of information is directly proportional to the maximum cluster size. It s an end goal of any social networking service providers to ensure that people have more means to create more connections resulting in a more connected (or compact) big network. It has been observed that undirected network tend to result in a bigger giant component as compared to directed network [2] Average Degree The degree of a node is the number of edges incident on it. The average degree of real-world networks is mostly found to be very unlike the random graph in their degree distribution. They are highly right skewed [8] meaning that the distributions have a long right tail of values that are far above the mean, and hence, they follow the power law. For more information on the degree distribution, please refer to the section 3.2. Assortativity / Correlation Coefficient [67] describe assortative mixing or assortativity as the correlations between properties of adjacent network nodes. People tend to associate with others based on the similarities between them - friends are related by their assortative mixing behavior. 29
38 Consequently, in a social network, we expect to see this sort of assortative matching. The opposite of this behavior is called disassortative mixing. Assortative mixing is indeed present in many networks, it can be measured and it does affect a network s structure and behavior [67]. [67] defines an assortativity coefficient that s is similar to the correlation coefficient defined by Pearson. In any given network, if r is the assortativity coefficient, then it can have a value from +1 to -1. Any value closer to +1 show that there is a correlation amongst nodes of similar degree. For a random network, the value of r will be around 0. Lastly, values closer to -1 show complete disassortativity because such a value is representative of relationships amongst nodes of different degree. People conducting research on networks prefer to measure assortative mixing by a scalar vertex property namely the vertex degree. We have assumed the same notion of correlation. Two observations can be made in terms of degree correlation: a) high/low-degree nodes preferring other high/low-degree nodes, or b) high/low-degree nodes preferring other low/high-degree nodes. It has been observed that both situations are present in some networks [8]. To quantify degree correlation r, we used [67]: Weighted Clustering Coefficient Previously, we showed some results pertaining to local egonets of a certain set of commenters. In real world networks, there are certain things that can be inferred based on 30
39 the high density of ties in a local neighborhood of nodes [14]. Such neighborhoods are examples of implicit formation of tightly knit clusters of nodes. Clustering Coefficient is a measure that assesses the degree to which nodes tend to cluster together. The presence of social characteristics in a network can be witnessed if the probability of high-density ties is relatively higher than a random network of similar magnitude. Such a measure can be used to obtain the local cluster cohesiveness and it is defined for any node n as the fraction of its connected neighbors [14]. The average clustering coefficient, which is thus expresses the statistical level of cohesiveness measuring the global density of interconnected vertices triples in the network [14]. A problem with overestimation of clustering properties was also pointed out. A new metric, which combined the topological information with the weight distribution of the network, namely weighted clustering coefficient, was defined as, By using the weighted local clustering coefficient measure, we are not just considering the number of closed triangles in the neighborhood of a vertex but also their total relative weight with respect to the vertex strength [14]. 31
40 Average Path Length A smaller value of average path length indicates that the network conforms to the idea of small-world effect. It is also concluded that most pairs of vertices in most networks seem to be connected by a short path through the network [2]. Maximum Distance Between Two Users This value tells us about how many edges it would take to travel from one node to any other node within a particular cluster. A smaller value of this measure is an indicative of similarity with a traditional social network and presence of Small World Effect Experimental Results Table Social network statistics for co-participation and reply-answer network Indicator Slashdot A Slashdot B Digg Net A Digg Net B Digg Net C N M N/M MC 73% 98% 76% 99.9% 99.8% AC D 13(50.1, 49.4) 22.36(79.3) WCC (0.074) 0.047(0.12) (0.259) n/a 0.78 (0.357) L 3.62 (0.7) 3.48(0.7) 3.79(0.72) 2.4(0.56) 2.29(0.48) MD In Table 4.3, N is the Number of nodes M is the Number of edges 32
41 N/M is the Ratio of nodes to edges MC is the Maximum Cluster Size AC is the Assortativity Coefficient or Correlation Coefficient D is the Average Degree WCC is the Weighted Clustering Coefficient L is the Average Path Length MD is the Maximum Distance between two users In this analysis, we have compared relevant network properties of five different network formations, which are derived from datasets collected from two different social bookmarking services namely, Digg and Slashdot. What follows is the description of the networks for which we have characterized the structural properties: Slashdot A Directed Reply Network of Slashdot A directed edge exists from V i to V j if V i replies to V j at least once. For more on this network formation, please refer to [2]. Slashdot B Undirected Reply network of Slashdot An undirected edge exists between V i and V j if either of the users replies to the other at least once. For more on this network formation, please refer to [2]. Digg Net A Directed Reply Network of Digg This formation takes the co-participation to a next level, which is essentially more restrictive resulting in fewer edges. Recall that a network where edges are a result of oneon-one interaction patterns within the context of a comment thread is a reply network [2]. 33
42 In this network, a directed edge exists between V i and V j if user I replied to V j in any of the comment threads of the stories in dataset. Digg Net B & C Undirected Co-participation Digg Networks with threshold 4 & 8 This network is relatively gigantic because of the nature of its formation. The underlying principle is very simple all commenters of a particular story are, to a certain extent, sharing interests. Then, if this behavior repeats itself, we capture it as something that strengthens the weight of individual edges b/w pairs of commenters. To proceed, we picked up 4 and 8 as the threshold values for edge weights, generating two co-participation networks respectively. So, if two users co-comment on 4 different stories, there is an edge between them in the 4-threshold network, but not in the 8-threshold network. On the other hand, if two users co-comment at least eight times, there exist an edge b/w them in both of these networks. The time complexity of the algorithm to compute this list of edges is directly proportional to the number of users in the network Discussion The results of the Slashdot networks were taken from the published study by Gomez et. al [2]. Amongst the network formations belonging to one of the two services (Digg or Slashdot), it should be noted that even the smallest Digg network is at least 3 times the size of any Slashdot network in terms on number of edges. Basically, we report several network statistics to characterize the derived graphs [8] for the co-participation networks defined across the Digg dataset for edge threshold values of 4 and 8. We also 34
43 report these statistics for the reply network defined in the Slashdot data study [2]. We compute the directed reply network for our Digg dataset for comparative purposes. The Table 4.3 also lists the total number of nodes N and edges M for the different network representations. As expected the co-participation networks has more edges or interactions between the different users in comparison to the directed reply networks. Looking at the ratios of nodes to edges, we realize that co-participation networks are relatively denser as compared to all other networks, in essence the reply networks. This is easy to justify because the easier the criteria for edge selection is, the denser the graph becomes. The ratios for the two co-participation networks are also supporting this idea as the ratio of Digg-B network (threshold 4) is almost half of the Digg-C network (threshold 8). We also report the maximum cluster size (MC) or the giant component size [8]. In case of the co-participation networks defined for the Digg data we see that 99% of the users are within a single giant cluster and are connected to each other. In comparison, 73% and 76% of the users form the giant component for the reply-answer networks defined for the Slashdot and Digg dataset, respectively. From this conclusion, we can claim that Takahashi s (2000, 2004) postulate concerning higher density networks is applicable on our networks too. The postulate states that higher density may lead to a higher level of generalized exchange by enabling faster, more complex flow of information about past behaviors of beneficiaries, allowing for better sanctioning. In short, the density of the giant component of these social book-marking services is directly proportional to the rate of information flow. 35
44 A higher standard deviation in average degree (k) (i.e., number of edges per node) represents a higher level of heterogeneity within the community. For the reply networks, the average degrees are of the same magnitude with slightly high standard deviations. However, in case of co-participation networks, the standard deviations are significantly higher than those of the reply networks that show that the community captured by a coparticipation formation is very heterogeneous. We have discussed the degree distributions earlier in section 3.1. We also report the average path length L and the maximal distance D in the largest cluster across the Digg and Slashdot networks. The co-participation network with edge threshold weight set to 8 has a smaller maximal distance. We also computed the degree correlation r for all Digg networks and we noted that none of the networks shows any assortative mixing by degree. For a network whose nodes demonstrate assortative mixing, this value should be closer to +1. Perhaps, based on our values, which are closer to 0 and -1, the Digg networks can be characterized by disassortative mixing. Interestingly, the values for Slashdot networks demonstrate a similar behavior. [2] states that Slashdot is characterized by neither assortative nor disassortative mixing. Such a behavior is comprehensible because people post comments on social bookmarking services without being concerned about the degree connectivity of the other commenters. 36
45 CHAPTER 5: POPULARITY PREDICTION OF ONLINE CONTENT 5.1. Introduction Using the comment information associated with posted stories at Digg we predicted the popularity of a story, the Digg-score (See Section 2.5). We wanted to develop a predictive model that would be able to accurately infer the Digg-score using associated comments made by the user community but restricted to the first few hours of the initial posting of the story. As such we trained predictive models using comments only from the first ten hours and the first fifteen hours. We also trained models using all the available comment information for comparison purposes Prediction Methods The prediction was performed by setting up three independent classification problems: (i) a 2-class, (ii) a 6-class, and (iii) a 14-class prediction problem. The bins for the 6-class and 14-class prediction problems were set in Digg-score intervals of 1000 and 500, respectively. For the 2-class prediction problem we split the instances into the first class having all stories with a Digg-score of less than 1000, and the second class with Digg-score greater than This allowed for a uniform size distribution split. We used the decision tree classifier [31], the nearest neighbor classifier [32], and support vector machines [33] for performing the classification. In this work we present the classification 37
46 results for the pruned C4.5 decision algorithm denoted by DT, the nearest neighbor classifier using nine neighbors denoted by 9-NN, and the support vector machine classifier using the linear and radial basis kernel function denoted by SVM (L) and SVM (R), respectively. For the K-class classification using SVMs, we trained K binary oneversus-rest classifiers for each of the K classes. We also estimated the Digg-score using - SVM regression method [6] (denoted by K=1) Feature Description We used several comment based and user focused features for predicting the Digg-score. These features capture different aspects of the data and are described in detail below: Comment Statistics We use the number of comments for a posted story, and the average word length of all the comments as features. A large number of posted comments are directly correlated to high level of user interest and hence, the popularity of stories. Both these features have shown success in predicting the best rated answer for a question within the context of Yahoo s QA Dataset [1]. When users comment they may chose to reply to a specific comment or make a new comment. This posting of comments induces a hierarchical tree structure where we can associate a level with every comment. A comment directly made to the story is considered as the first-level comment and can be thought of as initiating a thread. Analyzing our dataset we observed that a large number of levels are indicative of controversial stories. Controversial stories also have a tendency to be popular as seen in 38
47 the analysis done Slashdot [2]. Motivated by this we used four features that simply count the number of comments at the first, second, third, and fourth levels for each story. Digg User Interest Peak We captured the peak in user interest by determining the increase in user level activity within a fixed time span. We denote this feature as burst(x), and is computed as the highest comment activity seen when sliding a window of X hours across all the posted comments for a story. Specifically, we can represent burst(x) as where X is the burst window span, T is the total time since the story was submitted to the community, and C(x) is the number of comments within the x hours. We compute burst(3), burst(4), and burst(5) as three features for predicting the Digg score. The use of different windows captures different types of user interest for a story. A higher burst weight with a shorter time span carries more information towards the popularity prediction. Digg User Feedback Digg users also have the option of rating the comments. As such, comments that are irrelevant with respect to the posted story or are spam get negative feedback. Comments that are relevant and even cause of controversy are seen to get positive feedback from the user community. For each comment we obtain their up score (positive feedback) and the down score (negative feedback). We derive two features that sum the up scores for all the comments and sum the down scores for all the comments 39
48 associated with the story. Generally, for popular posts it was seen that the sums of up scores were higher than the sum of down scores. A similar comment feedback measure was shown to be positively correlated with the popular stories posted on Slashdot [2]. User Community Structure and Membership We also compute features that are focused on the egonets (described in Section 3.3) of the users with highly rated comments. We define top five comments per story as those comments having the highest comment score given by the difference of ups and downs. For each of these highly rated comment authors we use the degree or number of local neighbors (defined in Section 3.1) as a feature. This results in five features that use local information from the social network. We also use the two entropies (H 1 and H 2 ) computed for the categories and topics (Section 3.4) as a measure of knowledge associated with commenter. We use the average entropies for all the comment authors as features, and believe that this captures the knowledge-base and involvement of a user which would be important for predicting the Digg-score. Overall we use eighteen features to train our prediction models. For training models using the first ten hours, and the first fifteen hours after the story posting we recomputed the features. We standardize the feature values by centering on the mean. 40
49 5.4. Results and Discussion Table Performance for Digg-Score Prediction (Ten Hours Data only) Ten Hours Data K = 2 K = 6 Method ROC F1 Q_2 ROC F1 Q_6 DT NN SVM (L) SVM (R) K = 14 K = α Method ROC F1 Q_14 CC DT NN SVM (L) SVM (R) Table Performance for Digg-Score Prediction (Fifteen Hours Data only) Fifteen Hours Data K = 2 K = 6 Method ROC F1 Q_2 ROC F1 Q_6 DT NN SVM (L) SVM (R) K = 14 K = α Method ROC F1 Q_14 CC DT NN SVM (L) SVM (R)
50 Table Performance for Digg-Score Prediction (All Data) All Data K = 2 K = 6 Method ROC F1 Q_2 ROC F1 Q_6 DT NN SVM (L) SVM (R) K = 14 K = α Method ROC F1 Q_14 CC DT NN SVM (L) SVM (R) In Table 5.1, 5.2, and 5.3, we have listed the results of various regression and classification algorithms. DT, 9-NN, SVM (L), and SVM (R) denote the decision tree [31], 9 nearest neighbor classifier [32], SVM [33] with linear kernel, and SVM with radial basis kernel, respectively. ROC, F1, Q_K denote the average area under the ROC curve, F1 score, and K-way classification accuracy, respectively. CC denotes correlation coefficient. We highlight in bold the methods that perform the best classification or regression. The density estimation was performed using the µ-svr method. The results shows the classification and estimation results for the different class definitions, and using the comment features extracted for the first ten hours, first fifteen hours, and the complete data. We report a small sampling of the experiments we performed. In particular, we used the default parameters (regularization, width) for the SVM based 42
51 methods, and report results only for the nine nearest neighbor classifier that showed the best prediction results. To evaluate the performance of the classification and regression methods we performed 5-fold cross validation. The classification performance was evaluated using the K-way classification accuracy (Q K), the area under the receiver operating characteristics curve [34] (ROC), and the F-score (F1). The ROC measures the area under the plot of true positive rate versus the false positive rate, whereas the F1 provides a weighted average between precision and recall. We report the correlation coefficient (CC) between the actual and predicted Digg-score for evaluating the regression results. We used the Weka Toolkit [35] and LibSVM [36] for the popularity prediction. Firstly, we noticed that the two most discriminative features were the number of comments per story, and the sums of the ups (not shown here). These results are similar to the two similar works related to retrieving the popular posts in Slashdot [2], and predicting the best answer in the Yahoo QA dataset [1]. Analyzing these results, we observe that there is a slight improvement in the use of SVM based methods in comparison to the nearest neighbor and decision tree methods as the number of classes are increased. Solving the multi-class classification with higher number of classes is a challenging problem. The prediction performance of the classifiers and estimators when using the ten hours of data as well as the fifteen hours of data are comparable. We observe a 3.5%, 3.7%, and 1.32% decrease in the Q 2, Q 6, Q 14 accuracy when comparing the performance of prediction restricted to ten hours of data in comparison to the complete data, respectively. A similar trend is seen for the fifteen 43
52 hours of data. The low loss in accuracy suggests a merit in our predictive models for identifying the popularity of posted stories. Our results also show a strong CC for the predicted and original Digg-score using the -SVM regression method. The linear kernel is more effective in comparison to the radial basis kernel for the regression problem. 44
53 CHAPTER 6: OPINION MINING 6.1. Introduction In this thesis we incorporated new features pertaining to the semantics of user comments to predict the popularity of posted Digg stories. We used SentiWordNet [37], a lexical resource, which can be used to quantify the semantics of the opinionated text using various scores that are defined by it for a dictionary. We wanted to show that these new features are essential factors for (a) Evaluating the polarity of individual comments and (b) For using them in identifying the clusters of users with similar opinions / sentiments. There are two main types of textual information on the web as identified by [38]: Facts and Opinions (or Sentiments). Marketers, researchers and numerous web analysis companies have shown significant interest in extracting the opinions and sentiments implied by the commenters in their blog posts, comments, and discussions. There is a momentous amount of opinions on the internet spread across hundreds of discussion forums, and social bookmarking websites. 45
54 Extracting a sentiment hidden in a user s product review is very important. This study of extraction opinions, called Opinion Mining or interchangeably Sentiment Analysis [39], "is concerned not with the topic a text is about, but with the opinion it expresses" [37]. Among other things, it helps independent online retailers to rank the products based on the exact sentiments expressed in the reviews. Similarly, summarizing the opinions that follow a newsbreak in the first few hours is also important. Summarization of these opinions also plays a vital role if we can notice a trend in the evolution of polarity of opinions over a time period. We can identify the bursts that triggered the shift in opinions, or we can identify the users who influenced such a drift. Here, we are concentrating on identifying the most relevant feature set of Digg stories that contribute to its popularity. Previously, we achieved promising results by building classifiers over a number of such features. In this research extension, we have added semantic features that give us a summarized insight of the opinions embedded in the commentary that follows a news story Related Work Analyzing the opinions expressed in comments requires us to know the common sense polarity of individual words used in the comment. Researchers have been using gold standards - manual tagging of commonly used words to come up with prior polarities [40, 41, and 42]. It has also been observed that it is "harder to apply opinion bearing words collected from one domain to an application for another domain." [42] Opinions have also been categorized as either Judgments or Predictive Opinions [41]. Opinions where people express their likeness about something are called 46
55 Judgments, whereas, the expression of forecasting something based on one s beliefs is called Predictive Opinion. A lexical resource built upon WORDNET [43], which associates three numerical scores called Objectivity, Positivity, and Negativity (derived by combining the results produced by a committee of eight ternary classifiers), is known as SentiWordNet (SWN) [37]. A number of research works are based on SentiWordNet including [44, 45, 46, 47, 48, 49, 50]. In this work, we have also used SentiWordNet to identify opinionated words in individual comments, following by a summarization of all comments in a particular story. This work is an extension of our previous endeavor to build classifiers to predict popularity of Digg Stories and to characterize user behaviors across communities SentiWordNet SentiWordNet is officially promoted as a publicly available lexical resource that is ideally used for Opinion Mining. SWN extends WordNet synsets by associating with each of them three numerical scores: Objectivity(s), Positivity(s) and Negativity(s), which are a rough notation of how objective, positive, or negative the synset terms are. To sum it all, SWN lists for each word the details of all of its senses where a sense is nothing but one of the common use of the word. For example, the word casual has 9 different senses listed in SWN. Few negative senses (where negativity-score > positivity-score) of this word are: "an ability to interest casual students"; "a casual remark"; "a casual (or cursory) inspection failed to reveal the house's structural flaws"; 47
56 A positive sense (where positivity-score > negativity-score) can be: "casual clothes"; Moving on, for each sense, we have the following details: 1. Part of Speech, 2. Sense Rank, 3. Positivity Score, 4. Negativity Score, and 5. Objectivity Score (1 (Positivity Score + Negativity Score)). Before the compilation of SentiWordNet, researchers used varying techniques to quantify the positivity or negativity of commonly used opinionated words [41]. However, promising results achieved in works [51] show that SentiWordNet is a valuable resource that can facilitate extraction of opinions and sentiments from varying texts of different natures, including commentaries as we will discuss later. A direct parsing of the latest version of SentiWordNet was computationally infeasible because of the large number of lookups involved in the process as well as the unsorted nature of the data. We created a sorted and simplified list of all the words in SWN that enabled us to use binary search and achieve O(logN) time complexity. This version can be downloaded from our lab s website [83] Method Earlier, we described the community driven measure of popularity of a story posted at Digg, called Digg-Score. Stories can be roughly ranked based on these Digg Scores and a higher score represents a more popular story. In our research, we wanted to 48
57 train different classifiers to predict with maximum accuracy, the matured Digg-Scores of stories using information associated with the commentary done on those stories. We trained our predictive models using comments from the first ten hours and the first fifteen hours. We also trained models using all the available comment information for comparison purposes. Here, we have tried to explain the effect of introduced semantic features of the comments on our prediction models. In Table 2.1 (digg dataset statistics), we listed the breakup of our digg stories corpus into different categories. For each of these categories, we tried to build classifiers for the purpose of Digg-Score prediction by formulating three independent classification problems: (i) (ii) (iii) a 2-class prediction problem, a 6-class prediction problem, and a 14-class prediction problem. The bins for the 6-class and 14-class prediction problems were set in Digg-score intervals of 1000 and 500, respectively. For the 2-class prediction problem we split the instances into the first class having all stories with a Digg-score of less than 1000, and the second class with Digg-score greater than This allowed for a uniform size distribution split. We used the decision tree classifier [31], the nearest neighbor classifier [52], and support vector machines [53] for performing the classification. We hypothesized that features of commentaries on stories differ in their influence, and hence, their affect on the performance of the classifier would also give varying results. Informally, it makes sense to correlate the popularity of a story with for example, the 49
58 number of opinionated words used in comments that followed the story. Or, it can be assumed that a story gets more hits if it becomes more controversial as more comments are posted on it Feature Description As described earlier, for each word in SentiWordNet, there are different [positivity, negativity] sets of scores. One of these sets represents the most popular usage (called sense) of the word, and the rest follows it with decreasing popularity. While parsing the content of a particular comment, it wasn t easy to exactly identify the sense of some word used in the comment. So, we considered two sets of features and included them both: a. When considering weighted average of scores of all senses b. When considering the most popular score. Number of Sentimental words a. Given a story, we counted all the words for which we have the sentiment scores from any of the senses of its occurrence in SentiWordNet. b. Given a story, we counted all the words for which we have the sentiment scores from only its most popular sense. Example: Consider the word fidelity. In SentiWordNet, it has two senses. The most popular sense is neutral because its positivity as well as negativity scores are both zero. Hence, it s occurrence in any comment would not count under the popular-sense strategy, i.e. (b). However, its 2nd most popular sense entails positivity and hence under 50
59 the weighted-average counting strategy, i.e. (a), an occurrence of the word fidelity in any story s comment would contribute to the overall count of sentimental words. Sum of Positivity a. Given a story, we sum up the positivity scores of all the words that were counted as sentimental words. As defined earlier, for each word, we calculated the weighted average of the positivity scores of all its senses: b. In this case, for each word, we just picked its positivity score of the most popular sense. Sum of Negativity a. Given a story, we sum up the negativity scores of all the words that were counted as sentimental words. As defined earlier, for each word, we calculated the weighted average of the negativity scores of all its senses: b. In this case, for each word, we just picked its negativity score of the most popular sense. In sum, we have twenty six features that we used to train our prediction models. All the feature values were standardized using standard deviation: 51
60 6.6. Classification Results Table Predicion Results with Sentiment Features # classes Algorithm Weighted ROC F measure % of correctly classified instances 2 Decision Tree Decision Tree Decision Tree K Nearest Neighbor K Nearest Neighbor K Nearest Neighbor Table Prediction Results without Sentiment Features # classes Algorithm Weighted ROC F measure % of correctly classified instances 2 Decision Tree Decision Tree Decision Tree K Nearest Neighbor K Nearest Neighbor K Nearest Neighbor The above results are from a subset of the experiments we performed, and they show no clear sign of significant improvement in the prediction of Digg-score after we incorporate the sentiment-related features described previously. So, we conclude that a mere statistical analysis of semantic features isn t helpful enough in predicting the popularity of online content. Such a phenomenon exhibits a lack of a simplistic relation 52
61 between popularity of stories and naïve sentiments expressed in the follow up commentaries Discussion A further exploration in this direction should focus on extracting the intention of a commenter when he writes a comment. It is possible to tag domain dependent words being used by people in their comments. Such a dictionary can be very useful when we combine it with the information about a comment s level. For e.g. when a person A replies to person B, we already know that A wants to address something in B s comment. What we don t know, however, is the nature of A s feedback (a) it can be a refutation, (b) a statement of support, or (c) a mere expression that appends to whatever was stated by B. Recall that in a reply-answer network, there will be a directed edge from A to B. However, the edge itself doesn t tell us anything about nature of conversation between A and B. So, in a sense, in our reply-answer network and that of Slashdot s [2], we are making an assumption that an edge represents a weak friendship relationship. Using semantic analysis, we can get over this assumption and actually tag each of the links with tags like agreement, disagreement, or neutral. Figure 6.3 demonstrates a typical scenario. 53
62 B? C B Disagree C?? Disagree Agree A a A b B C A c Figure 6.3 Reply-network s edge between two users Figure 6.3 shows how we can use the edge tags to identify the communities of users based on how they think about a certain topic of interest. It s showing a fragment of a comment thread where A and C replied to B and A also replied to C. Figure 6.3 (a) shows that in a typical reply-network with no tagging for edges, it s not possible to characterize user communities based on sentiments. Figure 6.3 (b) shows that for the same scenario, we can tag edges if we get to know the sentiment expressed in the respective replies. Figure 6.3 (c) shows that A and C should belong to a community that disagrees with the opinion of B. 54
63 Although, our existing state-of-the-art research methods aren t good enough to extract such sentiment information; but in the development of one such framework, we believe that the very first step would remain the same i.e. the extraction of opinionated words and their intensity with respect to the norms of the underlying story s domain, but this alone does not suffice. In the future, we plan to extract these opinions by plotting each comment against a Problem-Reduction model [54]. Such a technique is used in Expert System studies, where a problem is divided into sub problems, and until we reach the atomic problems that can be solved by mere knowledge of facts. Then the solution of these sub problems are combined and finally the root problem gets a weighted solution, which is nothing but a statistical solution suggested by its direct sub-problems. The same analogy is applicable in the case of Opinion mining. Remember that our goal ideally is to tag each comment with one sentiment, although this can be tricky too because not all commenters are decisive in their suggestions about a particular topic they are discussing. However, by knowing the opinionated words used in the comment we already know the factual answers to the leaf nodes of our Problem-Reduction tree. Going up by one level, we should combine this information to devise the opinions expressed in individual sentences, and so on. Finally, we could combine these suggestive low-level opinions and tag the overall comment by a sentiment. 55
64 CHAPTER 7: TIMED EGONETS TRACING PERIODICITY 7.1. Introduction In Section 3.3, we demonstrated our ability to characterize users based on egonets of most active commenters across different Digg categories. This observation of communities was isolated for each of the eight categories, within which, we observed varying patterns of interactions. Firstly, the egonets were generated for the most active few users of each of the eight categories. Also, it was a possibility for a particular user to show up in 2 or more list of most active users, i.e. a commenter who is amongst the most active people in multiple categories. To capture the interactions of these commenters and their neighbors, we assumed full knowledge of the dataset. We classified the interactions into two categories interaction between users who belong to the same category (black edges), and interactions between users who belong to different categories (green edges). This categorization helped us to relate observations of egonets to heterogeneity of user interests. The dataset is analyzed a collection of stories spread across a span of approximately 500 days. There are certain implications of this idea of full utilization of dataset most importantly, the egonets were independent of any time factor. Is, the activity measure 56
65 taking into consideration the presence (or absence) of a constant user activity? What if the user was so active in only a few days that he turned out to be amongst the most active users who were constant in their activity throughout the 500 days? Should we distinguish between users who are sporadically active, versus constantly active? Does time play any role in the formation and comparison of egonets? Here, we tried to answer these questions and others by introducing a relatively newer concept, which we call Timed Egonets. Previously, each of the active users was being represented by a single egonet. We extended this idea by generating multiple egonets for one user. The number of egonets per user is the number of bins or partitions that we created for the 500 days dataset. So, if we assume that there will be 5 bins, each of 100 days, then for each of the most active users, we will have 5 egonets. Each of these egonets would be generated by assuming the factual knowledge of only those days, which are covered by the particular bin representing the egonet. We hoped to capture insightful results by applying the concept to the same Digg dataset Process The process of generating these egonets is as follows: First, we sort out in descending order the complete list of unique commenters by their cardinality, i.e. the number of comments they have posted over the duration of entire dataset. So, the user on top of this list is by all means the overall most active user. Then, we pick the top 15 users from this list. 57
66 In the next step, we divided the entire dataset into 8 bins as reported in Table 7.1: Table Classification of Digg stories into constant sized bins 2-month bins # Stories From Date To Date bin Nov Jan 2008 bin Jan Mar 2008 bin Mar May 2008 bin May Jul 2008 bin Jul Sep 2008 bin Sep Nov 2008 bin Nov Jan 2009 bin Jan Mar Nov Mar 2009 Against each of the top user, an egonet was generated for each of the abovementioned bins. So essentially, We had 58
 Green Edges (Outside Category) Figure 7.2 - Average Degree for the 16 most active users in two month periods.")
67 7.3. Results and Discussion stories 3922 stories 4635 stories 4002 stories 4502 stories 5096 stories 4986 stories 5560 stories Nov Jan Mar May Jul Sep Nov Jan 2009 Black Edges (Within Category) Green Edges (Outside Category) Figure Average Degree for the 16 most active users in two month periods. In Figure 7.2 we present the average degree for the users (the average in-category degree and out-category degree as computed in Section 4.3). In essence, we derived the implicit social network between the users for the posts and comments posted within the two month period windows. We notice that there is an apparent increase in the average degrees for periods of four months from March 15, 2008 to July 14, Within the particular period there might be topics that have indulged users to increase in their usual pattern of activity. The period was known for the current president, Barack Obama 59
68 winning the Democratic candidate nomination and transitioning to campaign for the President s office. We also notice that the average overall degree is correlated to the average in-category degree represented by the black colored edges in the egonets. This may suggest that as content becomes popular it tends to increase the homogeneity of user interests. Recall that we use egonet analysis to understand the relationships amongst different users within the different categories. Similar analysis was done in [1] to differentiate between community of users that were discussion prone or not. A one level egonet for a user is defined as the user, the set of users who interact directly with the user (neighbors), and the relationships between those users. We can extend the definition of egonet to have neighbors who are N hops (links) away from the user in consideration. As described previously, our 1-hop egonets have a two color coding scheme where a co-participation edge E i,j is colored black if both V i and V j have the same category membership, whereas edge V i and V j is colored green if users V i and V j belong to different categories. 60

69 Figure 7.3 Timed Egonets 61
70 Recall that we use egonet analysis to understand the relationships amongst different users within the different categories. Similar analysis was done in [1] to differentiate between community of users that were discussion prone or not. A one level egonet for a user is defined as the user, the set of users who interact directly with the user (neighbors), and the relationships between those users. We can extend the definition of egonet to have neighbors who are N hops (links) away from the user in consideration. As described previously, our 1-hop egonets have a two color coding scheme where a co-participation edge E i,j is colored black if both V i and V j have the same category membership, whereas edge V i and V j is colored green if users V i and V j belong to different categories. The idea of timed egonets is to trace the evolution of interaction behavior of active users, and somehow, characterize the evolution patterns of commenters in general, across different categories. Such an evolution could be correlated to world events that were incident at a certain point in time. Earlier, we prescribed two criteria to analyze an egonet Edge Densities, and Colored Densities. From the results, we could have expected a few outcomes: Steady increase in edge density (and/or color densities) of a user s time egonets Steady decrease in edge density (and/or color densities) of a user s timed egonets Constant density (and/or color densities) Constant edge density but changing color densities. No visible pattern, i.e. abrupt changes in densities. 62
71 Having mentioned that, let s discuss the timed-egonets shown above. Figure 7.3 shows the timed egonets for 1 st, 3 rd, 5 th, 7 th and 9 th most active users for each of the 8 story bins. Each of the egonets for a particular commenter is mutually exclusive meaning that it represents his interaction behavior for one specific chunk of stories contained in the respective story bin. The idea is to capture a trend of his activity over the time-sorted bins. A mutually inclusive set of egonets wouldn t tell us much except that each egonet would be to a certain extent, denser than the previous one. Before analyzing the color variations, the very first thing that s apparent is the burst in density of egonets for bin 2 and bin 3, which is also evident in Figure 7.3. So, in a sense, the growth of social associations on social book-marking services is primarily dependent on the content that is being shared by the community. If the content pushes the community to comment, then indirectly, the strength of edges amongst the active users improves in due proportion. Next, we don t see any visible density evolution patterns. The densities of egonets, which are sorted by time, are rather presenting a random change. This behavior is unlike what can be observed in typical social networks. Apparently, one of the most important factors in improving the average edge strength in our implicit network is again the content that is being served by the Digg platform. Finally, we see that for the same bins where we witnessed sudden burst in activities, the density of black color edges in particular, is higher as compared to green edges. There cannot be a hard and fast conclusion that can be made from this rough observation. However, to some extent, people tend to become more active in proportion to the people they know as being from the same interest group (the Digg category). Note 63
72 that, with each commenter we ve an associated Digg category. This association is derived by classifying the comments a user posted into different Digg categories, and then, picking up the category that received highest number of comments. So, increase in the black-edge density means that the strength of a commenter s linkages with new people (and his existing neighbors) has increase. 64
73 CHAPTER 8: APPLICATIONS 8.1. THE DIGG EFFECT To handle load, a website can be hosted on a number of parallel running webservers to serve as much web requests as possible. This replication essentially increases the overall capacity of the web services, but, it incurs a cost, i.e. upfront investment in physical web servers, virtualization technologies, database replications, and load balancing switches, which is a risk in itself. Such a strategy might be effective and perhaps necessary for popular websites, but it s unjustified when it comes to less popular websites, for which, the hit counts are at a low average, with some unpredictable bursts in hit counts. When a popular website like Digg links to a smaller site, causing a massive increase in traffic, the smaller website may slow down or even temporarily shut-down; this phenomenon is called The Slashdot Effect, or Slashdotting, or The Digg Effect. The community of Slashdot and Digg also known as flash crowds [68], are responsible for this behavior because of the almost instantaneous millions of clicks that are generated for submissions promoted to the front page. To understand better, let s follow a simple example. Consider that we are hosting a personal video blog where we upload one popular video on a daily basis. Usually, our 65
74 12:00 AM 1:00 AM 2:00 AM 3:00 AM 4:00 AM 5:00 AM 6:00 AM 7:00 AM 8:00 AM 9:00 AM 10:00 AM 11:00 AM 12:00 PM 1:00 PM 2:00 PM 3:00 PM 4:00 PM 5:00 PM 6:00 PM 7:00 PM 8:00 PM 9:00 PM 10:00 PM 11:00 PM webpage get an average of hits per day and the capacity of your web server is good enough to handle this load. Figure 8.1 is a simulated graph that shows a typical visitors graph of your website for a random day. U n i q u e V i i s t s H o u r o f t h e d a y Figure Unique visits per hour - Normal behavior without Digg Effect Now, suppose that someone in the internet community liked one of our video links and posted it on any of the popular social bookmarking services, like Slashdot, Reddit and Digg. Very soon, other people started liking your link, and eventually, the video link becomes so popular that it swiftly makes it way to the front page of the social bookmarking website. 66


75 12:00 AM 1:00 AM 2:00 AM 3:00 AM 4:00 AM 5:00 AM 6:00 AM 7:00 AM 8:00 AM 9:00 AM 10:00 AM 11:00 AM 12:00 PM 1:00 PM 2:00 PM 3:00 PM 4:00 PM 5:00 PM 6:00 PM 7:00 PM 8:00 PM 9:00 PM 10:00 PM 11:00 PM If the website is vulnerable to the Digg Effect, then for the particular day, our visitor graph will look like Figure 8.2. At approximately 3:00 am, the website link makes it to the front page of Digg that result in flash crowds hitting the server at a much higher rate. For as long as the web server can sustain, the visit counts kept on increasing until the threshold is reached at 7:00 am, which results in thrashing and denial of services. Finally, at 9:00 am, the server is down, and no more requests are being served. With human intervention, the server is up again by 3:00 pm after 6 hours of denial of services. The visit counts start to grow again, and eventually, once the story gradually slides out of the front page, the visit count shrinks, and the trend would returns to the normal behavior. U n i q u e V i i s t s H o u r o f t h e d a y Figure Unique visits per hour with Digg Effect [84] 67
Predicting Information Diffusion Initiated from Multiple Sources in Online Social Networks
 Predicting Information Diffusion Initiated from Multiple Sources in Online Social Networks Chuan Peng School of Computer science, Wuhan University Email: chuan.peng@asu.edu Kuai Xu, Feng Wang, Haiyan Wang
Measurement and Analysis of an Online Content Voting Network: A Case Study of Digg
 Measurement and Analysis of an Online Content Voting Network: A Case Study of Digg Yingwu Zhu Department of CSSE, Seattle University Seattle, WA 9822, USA zhuy@seattleu.edu ABSTRACT In online content voting
Social Computing in Blogosphere
 Social Computing in Blogosphere Opportunities and Challenges Nitin Agarwal* Arizona State University (Joint work with Huan Liu, Sudheendra Murthy, Arunabha Sen, Lei Tang, Xufei Wang, and Philip S. Yu)
Recommendations For Reddit Users Avideh Taalimanesh and Mohammad Aleagha Stanford University, December 2012
 Recommendations For Reddit Users Avideh Taalimanesh and Mohammad Aleagha Stanford University, December 2012 Abstract In this paper we attempt to develop an algorithm to generate a set of post recommendations
Link Attraction Factors
 Link Attraction Factors A study of the factors that influence the number of links a URL published to Digg s homepage accumulates. By Dan Zarrella http://danzarrella.com 2008 Introduction & Dataset One
Subreddit Recommendations within Reddit Communities
 Subreddit Recommendations within Reddit Communities Vishnu Sundaresan, Irving Hsu, Daryl Chang Stanford University, Department of Computer Science ABSTRACT: We describe the creation of a recommendation
The Social Web: Social networks, tagging and what you can learn from them. Kristina Lerman USC Information Sciences Institute
 The Social Web: Social networks, tagging and what you can learn from them Kristina Lerman USC Information Sciences Institute The Social Web The Social Web is a collection of technologies, practices and
arxiv:cs/ v1 [cs.hc] 7 Dec 2006
![arxiv:cs/ v1 [cs.hc] 7 Dec 2006](/thumbs/71/65975462.jpg "arxiv:cs/ v1 [cs.hc] 7 Dec 2006") Social Networks and Social Information Filtering on Digg Kristina Lerman University of Southern California Information Sciences Institute 4676 Admiralty Way Marina del Rey, California 9292 lerman@isi.edu
Social Networks and Social Information Filtering on Digg Kristina Lerman University of Southern California Information Sciences Institute 4676 Admiralty Way Marina del Rey, California 9292 lerman@isi.edu
VOTING DYNAMICS IN INNOVATION SYSTEMS
 VOTING DYNAMICS IN INNOVATION SYSTEMS Voting in social and collaborative systems is a key way to elicit crowd reaction and preference. It enables the diverse perspectives of the crowd to be expressed and
CSE 190 Professor Julian McAuley Assignment 2: Reddit Data. Forrest Merrill, A Marvin Chau, A William Werner, A
 1 CSE 190 Professor Julian McAuley Assignment 2: Reddit Data by Forrest Merrill, A10097737 Marvin Chau, A09368617 William Werner, A09987897 2 Table of Contents 1. Cover page 2. Table of Contents 3. Introduction
An Exploratory study of the Video Bloggers Community
 Association for Information Systems AIS Electronic Library (AISeL) SIGHCI 2009 Proceedings Special Interest Group on Human-Computer Interaction 2009 An Exploratory study of the Video Bloggers Community
An Integrated Tag Recommendation Algorithm Towards Weibo User Profiling
 An Integrated Tag Recommendation Algorithm Towards Weibo User Profiling Deqing Yang, Yanghua Xiao, Hanghang Tong, Junjun Zhang and Wei Wang School of Computer Science Shanghai Key Laboratory of Data Science
A comparative analysis of subreddit recommenders for Reddit
 A comparative analysis of subreddit recommenders for Reddit Jay Baxter Massachusetts Institute of Technology jbaxter@mit.edu Abstract Reddit has become a very popular social news website, but even though
CSE 190 Assignment 2. Phat Huynh A Nicholas Gibson A
 CSE 190 Assignment 2 Phat Huynh A11733590 Nicholas Gibson A11169423 1) Identify dataset Reddit data. This dataset is chosen to study because as active users on Reddit, we d like to know how a post become
Do two parties represent the US? Clustering analysis of US public ideology survey
 Do two parties represent the US? Clustering analysis of US public ideology survey Louisa Lee 1 and Siyu Zhang 2, 3 Advised by: Vicky Chuqiao Yang 1 1 Department of Engineering Sciences and Applied Mathematics,
Statistical Analysis of Corruption Perception Index across countries
 Statistical Analysis of Corruption Perception Index across countries AMDA Project Summary Report (Under the guidance of Prof Malay Bhattacharya) Group 3 Anit Suri 1511007 Avishek Biswas 1511013 Diwakar
PREDICTING COMMUNITY PREFERENCE OF COMMENTS ON THE SOCIAL WEB
 PREDICTING COMMUNITY PREFERENCE OF COMMENTS ON THE SOCIAL WEB A Thesis by CHIAO-FANG HSU Submitted to the Office of Graduate Studies of Texas A&M University in partial fulfillment of the requirements for
Understanding factors that influence L1-visa outcomes in US
 Understanding factors that influence L1-visa outcomes in US By Nihar Dalmia, Meghana Murthy and Nianthrini Vivekanandan Link to online course gallery : https://www.ischool.berkeley.edu/projects/2017/understanding-factors-influence-l1-work
Intersections of political and economic relations: a network study
 Procedia Computer Science Volume 66, 2015, Pages 239 246 YSC 2015. 4th International Young Scientists Conference on Computational Science Intersections of political and economic relations: a network study
Preliminary Effects of Oversampling on the National Crime Victimization Survey
 Preliminary Effects of Oversampling on the National Crime Victimization Survey Katrina Washington, Barbara Blass and Karen King U.S. Census Bureau, Washington D.C. 20233 Note: This report is released to
Experiments on Data Preprocessing of Persian Blog Networks
 Experiments on Data Preprocessing of Persian Blog Networks Zeinab Borhani-Fard School of Computer Engineering University of Qom Qom, Iran Behrouz Minaie-Bidgoli School of Computer Engineering Iran University
Evaluating the Role of Immigration in U.S. Population Projections
 Evaluating the Role of Immigration in U.S. Population Projections Stephen Tordella, Decision Demographics Steven Camarota, Center for Immigration Studies Tom Godfrey, Decision Demographics Nancy Wemmerus
EasyChair Preprint. (Anti-)Echo Chamber Participation: Examing Contributor Activity Beyond the Chamber
Echo Chamber Participation: Examing Contributor Activity Beyond the Chamber") EasyChair Preprint 122 (Anti-)Echo Chamber Participation: Examing Contributor Activity Beyond the Chamber Ella Guest EasyChair preprints are intended for rapid dissemination of research results and are
EasyChair Preprint 122 (Anti-)Echo Chamber Participation: Examing Contributor Activity Beyond the Chamber Ella Guest EasyChair preprints are intended for rapid dissemination of research results and are
Data manipulation in the Mexican Election? by Jorge A. López, Ph.D.
 Data manipulation in the Mexican Election? by Jorge A. López, Ph.D. Many of us took advantage of the latest technology and followed last Sunday s elections in Mexico through a novel method: web postings
DU PhD in Home Science
 DU PhD in Home Science Topic:- DU_J18_PHD_HS 1) Electronic journal usually have the following features: i. HTML/ PDF formats ii. Part of bibliographic databases iii. Can be accessed by payment only iv.
Learning and Visualizing Political Issues from Voting Records Erik Goldman, Evan Cox, Mikhail Kerzhner. Abstract
 Learning and Visualizing Political Issues from Voting Records Erik Goldman, Evan Cox, Mikhail Kerzhner Abstract For our project, we analyze data from US Congress voting records, a dataset that consists
Designing Weighted Voting Games to Proportionality
 Designing Weighted Voting Games to Proportionality In the analysis of weighted voting a scheme may be constructed which apportions at least one vote, per-representative units. The numbers of weighted votes
Approval Voting Theory with Multiple Levels of Approval
 Claremont Colleges Scholarship @ Claremont HMC Senior Theses HMC Student Scholarship 2012 Approval Voting Theory with Multiple Levels of Approval Craig Burkhart Harvey Mudd College Recommended Citation
Introduction to using social media
 Introduction to using social media M&A International Inc. Fall Conference Istanbul 7 9 October 2010 Melanie Berthelot-Verhaeghe Agenda What is social media? Should we care? What is out there? Is this stuff
An Homophily-based Approach for Fast Post Recommendation in Microblogging Systems
 An Homophily-based Approach for Fast Post Recommendation in Microblogging Systems Quentin Grossetti 1,2 Supervised by Cédric du Mouza 2, Camelia Constantin 1 and Nicolas Travers 2 1 LIP6 - Université Pierre
Topicality, Time, and Sentiment in Online News Comments
 Topicality, Time, and Sentiment in Online News Comments Nicholas Diakopoulos School of Communication and Information Rutgers University diakop@rutgers.edu Mor Naaman School of Communication and Information
Estimating the Margin of Victory for Instant-Runoff Voting
 Estimating the Margin of Victory for Instant-Runoff Voting David Cary Abstract A general definition is proposed for the margin of victory of an election contest. That definition is applied to Instant Runoff
Hyo-Shin Kwon & Yi-Yi Chen
 Hyo-Shin Kwon & Yi-Yi Chen Wasserman and Fraust (1994) Two important features of affiliation networks The focus on subsets (a subset of actors and of events) the duality of the relationship between actors
X.Org Development Discussion Continues. Related Topics: Related Articles. Daylife Publishers Log In. Blog Developers Publishers
 1 of 6 10/30/2009 1:54 PM Daylife Publishers Log In Blog Developers Publishers Top News World Business Politics Entertainment Sports Science & Technology More Topics Home Topics Linux Story Linux Search
VS. Who REALLY Owns the Web?
 VS. Who REALLY Owns the Web? A closer look at the online battle for The White House 1. Overview The battle between John and Barack is a war of words. What makes this election different is how far and fast
Wasserman & Faust, chapter 5
 Wasserman & Faust, chapter 5 Centrality and Prestige - Primary goal is identification of the most important actors in a social network. - Prestigious actors are those with large indegrees, or choices received.
Immigration and Multiculturalism: Views from a Multicultural Prairie City
 Immigration and Multiculturalism: Views from a Multicultural Prairie City Paul Gingrich Department of Sociology and Social Studies University of Regina Paper presented at the annual meeting of the Canadian
Stochastic Models of Social Media Dynamics
 Stochastic Models of Social Media Dynamics Kristina Lerman, Aram Galstyan, Greg Ver Steeg USC Information Sciences Institute Marina del Rey, CA Tad Hogg Institute for Molecular Manufacturing Palo Alto,
101 Ways Your Intern Can Triple Your Website Traffic & Performance This Year
 101 Ways Your Intern Can Triple Your Website Traffic & Performance This Year For 99% of entrepreneurs and business owners, we have identified what we believe are the top 101 highest leverage, most profitable
STATISTICAL GRAPHICS FOR VISUALIZING DATA
 STATISTICAL GRAPHICS FOR VISUALIZING DATA Tables and Figures, I William G. Jacoby Michigan State University and ICPSR University of Illinois at Chicago October 14-15, 21 http://polisci.msu.edu/jacoby/uic/graphics
A secure environment for trading
 A secure environment for trading https://serenity-financial.io/ Bounty Program The arbitration platform will address the problem of transparent and secure trading on financial markets for millions of traders
No Adults Allowed! Unsupervised Learning Applied to Gerrymandered School Districts
 No Adults Allowed! Unsupervised Learning Applied to Gerrymandered School Districts Divya Siddarth, Amber Thomas 1. INTRODUCTION With more than 80% of public school students attending the school assigned
Changes in Wage Inequality in Canada: An Interprovincial Perspective
 s u m m a r y Changes in Wage Inequality in Canada: An Interprovincial Perspective Nicole M. Fortin and Thomas Lemieux t the national level, Canada, like many industrialized countries, has Aexperienced
Congressional Forecast. Brian Clifton, Michael Milazzo. The problem we are addressing is how the American public is not properly informed about
 Congressional Forecast Brian Clifton, Michael Milazzo The problem we are addressing is how the American public is not properly informed about the extent that corrupting power that money has over politics
Using Social Media to Build Your Brand. Susan Getgood
 Using Social Media to Build Your Brand Susan Getgood 1 Myth: Social Media is for Kids 2 The Facts 3 The Facts Social Media has Grown Sharply Year Over Year +% Percentage of Growth (From March 2009 to March
SIERRA LEONE 2012 ELECTIONS PROJECT PRE-ANALYSIS PLAN: INDIVIDUAL LEVEL INTERVENTIONS
 SIERRA LEONE 2012 ELECTIONS PROJECT PRE-ANALYSIS PLAN: INDIVIDUAL LEVEL INTERVENTIONS PIs: Kelly Bidwell (IPA), Katherine Casey (Stanford GSB) and Rachel Glennerster (JPAL MIT) THIS DRAFT: 15 August 2013
THE GOP DEBATES BEGIN (and other late summer 2015 findings on the presidential election conversation) September 29, 2015
 September 29, 2015") THE GOP DEBATES BEGIN (and other late summer 2015 findings on the presidential election conversation) September 29, 2015 INTRODUCTION A PEORIA Project Report Associate Professors Michael Cornfield and
THE GOP DEBATES BEGIN (and other late summer 2015 findings on the presidential election conversation) September 29, 2015 INTRODUCTION A PEORIA Project Report Associate Professors Michael Cornfield and
Return on Investment from Inbound Marketing through Implementing HubSpot Software
 Return on Investment from Inbound Marketing through Implementing HubSpot Software August 2011 Prepared By: Kendra Desrosiers M.B.A. Class of 2013 Sloan School of Management Massachusetts Institute of Technology
REMITTANCE TRANSFERS TO ARMENIA: PRELIMINARY SURVEY DATA ANALYSIS
 REMITTANCE TRANSFERS TO ARMENIA: PRELIMINARY SURVEY DATA ANALYSIS microreport# 117 SEPTEMBER 2008 This publication was produced for review by the United States Agency for International Development. It
Corruption's Effect on Socioeconomic Factors
 College of Saint Benedict and Saint John's University DigitalCommons@CSB/SJU Celebrating Scholarship & Creativity Day Experiential Learning & Community Engagement 2016 Corruption's Effect on Socioeconomic
Pioneers in Mining Electronic News for Research
 Pioneers in Mining Electronic News for Research Kalev Leetaru University of Illinois http://www.kalevleetaru.com/ Our Digital World 1/3 global population online As many cell phones as people on earth
Analyzing and Representing Two-Mode Network Data Week 8: Reading Notes
 Analyzing and Representing Two-Mode Network Data Week 8: Reading Notes Wasserman and Faust Chapter 8: Affiliations and Overlapping Subgroups Affiliation Network (Hypernetwork/Membership Network): Two mode
CALTECH/MIT VOTING TECHNOLOGY PROJECT A
 CALTECH/MIT VOTING TECHNOLOGY PROJECT A multi-disciplinary, collaborative project of the California Institute of Technology Pasadena, California 91125 and the Massachusetts Institute of Technology Cambridge,
Computational challenges in analyzing and moderating online social discussions
 Computational challenges in analyzing and moderating online social discussions Aristides Gionis Department of Computer Science Aalto University Machine learning coffee seminar Oct 23, 2017 social media
Reddit Advertising: A Beginner s Guide To The Self-Serve Platform. Written by JD Prater Sr. Account Manager and Head of Paid Social
 Reddit Advertising: A Beginner s Guide To The Self-Serve Platform Written by JD Prater Sr. Account Manager and Head of Paid Social Started in 2005, Reddit has become known as The Front Page of the Internet,
Ushio: Analyzing News Media and Public Trends in Twitter
 Ushio: Analyzing News Media and Public Trends in Twitter Fangzhou Yao, Kevin Chen-Chuan Chang and Roy H. Campbell 3rd International Workshop on Big Data and Social Networking Management and Security (BDSN
Vote Compass Methodology
 Vote Compass Methodology 1 Introduction Vote Compass is a civic engagement application developed by the team of social and data scientists from Vox Pop Labs. Its objective is to promote electoral literacy
Cluster Analysis. (see also: Segmentation)
") Cluster Analysis (see also: Segmentation) Cluster Analysis Ø Unsupervised: no target variable for training Ø Partition the data into groups (clusters) so that: Ø Observations within a cluster are similar
Cluster Analysis (see also: Segmentation) Cluster Analysis Ø Unsupervised: no target variable for training Ø Partition the data into groups (clusters) so that: Ø Observations within a cluster are similar
The 2017 TRACE Matrix Bribery Risk Matrix
 The 2017 TRACE Matrix Bribery Risk Matrix Methodology Report Corruption is notoriously difficult to measure. Even defining it can be a challenge, beyond the standard formula of using public position for
Supporting Information Political Quid Pro Quo Agreements: An Experimental Study
 Supporting Information Political Quid Pro Quo Agreements: An Experimental Study Jens Großer Florida State University and IAS, Princeton Ernesto Reuben Columbia University and IZA Agnieszka Tymula New York
Post-2008 Crisis in Labor Standards: Prospects for Labor Regulation Around the World
 Post-2008 Crisis in Labor Standards: Prospects for Labor Regulation Around the World Michael J. Piore David W. Skinner Professor of Political Economy Department of Economics Massachusetts Institute of
Response to the Evaluation Panel s Critique of Poverty Mapping
 Response to the Evaluation Panel s Critique of Poverty Mapping Peter Lanjouw and Martin Ravallion 1 World Bank, October 2006 The Evaluation of World Bank Research (hereafter the Report) focuses some of
VISA LOTTERY SERVICES REPORT FOR DV-2007 EXECUTIVE SUMMARY
 VISA LOTTERY SERVICES REPORT FOR DV-2007 EXECUTIVE SUMMARY BY J. STEPHEN WILSON CREATIVE NETWORKS WWW.MYGREENCARD.COM AUGUST, 2005 In our annual survey of immigration web sites that advertise visa lottery
3 Electoral Competition
 3 Electoral Competition We now turn to a discussion of two-party electoral competition in representative democracy. The underlying policy question addressed in this chapter, as well as the remaining chapters
Politicians as Media Producers
 Politicians as Media Producers Nowadays many politicians use social media and the number is growing. One of the reasons is that the web is a perfect medium for genuine grass-root political movements. It
Impact of Human Rights Abuses on Economic Outlook
 Digital Commons @ George Fox University Student Scholarship - School of Business School of Business 1-1-2016 Impact of Human Rights Abuses on Economic Outlook Benjamin Antony George Fox University, bantony13@georgefox.edu
arxiv: v1 [cs.cy] 29 Apr 2010
![arxiv: v1 [cs.cy] 29 Apr 2010](/thumbs/88/117668241.jpg "arxiv: v1 [cs.cy] 29 Apr 2010") Using a Model of Social Dynamics to Predict Popularity of News Kristina Lerman USC Information Sciences Institute 4676 Admiralty Way, Marina del Rey, CA 90292 Tad Hogg HP Labs 1501 Page Mill Road, Palo
Using a Model of Social Dynamics to Predict Popularity of News Kristina Lerman USC Information Sciences Institute 4676 Admiralty Way, Marina del Rey, CA 90292 Tad Hogg HP Labs 1501 Page Mill Road, Palo
American Congregations and Social Service Programs: Results of a Survey
 American Congregations and Social Service Programs: Results of a Survey John C. Green Ray C. Bliss Institute of Applied Politics University of Akron December 2007 The views expressed here are those of
Copyright is owned by the Author of the thesis. Permission is given for a copy to be downloaded by an individual for the purpose of research and
 Copyright is owned by the Author of the thesis. Permission is given for a copy to be downloaded by an individual for the purpose of research and private study only. The thesis may not be reproduced elsewhere
Classifier Evaluation and Selection. Review and Overview of Methods
 Classifier Evaluation and Selection Review and Overview of Methods Things to consider Ø Interpretation vs. Prediction Ø Model Parsimony vs. Model Error Ø Type of prediction task: Ø Decisions Interested
1. ISSUING AGENCY: The City of Albuquerque Human Resources Department.
 TITLE CHAPTER 3 PART 7 HUMAN RESOURCES DEPARTMENT CONDITIONS OF EMPLOYMENT SOCIAL MEDIA POLICY 1. ISSUING AGENCY: The City of Albuquerque Human Resources Department. 2. SCOPE: These rules have general
Patterns in Congressional Earmarks
 Patterns in Congressional Earmarks Chris Musialek University of Maryland, College Park 8 November, 2012 Introduction This dataset from Taxpayers for Common Sense captures Congressional appropriations earmarks
Why Biometrics? Why Biometrics? Biometric Technologies: Security and Privacy 2/25/2014. Dr. Rigoberto Chinchilla School of Technology
 Biometric Technologies: Security and Privacy Dr. Rigoberto Chinchilla School of Technology Why Biometrics? Reliable authorization and authentication are becoming necessary for many everyday actions (or
information it takes to make tampering with an election computationally hard.
 Chapter 1 Introduction 1.1 Motivation This dissertation focuses on voting as a means of preference aggregation. Specifically, empirically testing various properties of voting rules and theoretically analyzing
2011 The Pursuant Group, Inc.
 Using Facebook & Social Media to Power Up your Engagement Barbara Talisman Initiate the Relationship Initiate the Relationship by reaching out to the places where your target audience aggregates Motivate
Users reading habits in online news portals
 Esiyok, C., Kille, B., Jain, B.-J., Hopfgartner, F., & Albayrak, S. Users reading habits in online news portals Conference paper Accepted manuscript (Postprint) This version is available at https://doi.org/10.14279/depositonce-7168
Quantitative Prediction of Electoral Vote for United States Presidential Election in 2016
 Quantitative Prediction of Electoral Vote for United States Presidential Election in 2016 Gang Xu Senior Research Scientist in Machine Learning Houston, Texas (prepared on November 07, 2016) Abstract In
A Dead Heat and the Electoral College
 A Dead Heat and the Electoral College Robert S. Erikson Department of Political Science Columbia University rse14@columbia.edu Karl Sigman Department of Industrial Engineering and Operations Research sigman@ieor.columbia.edu
Chapter 1 Introduction and Goals
 Chapter 1 Introduction and Goals The literature on residential segregation is one of the oldest empirical research traditions in sociology and has long been a core topic in the study of social stratification
Matthew A. Cole and Eric Neumayer. The pitfalls of convergence analysis : is the income gap really widening?
 LSE Research Online Article (refereed) Matthew A. Cole and Eric Neumayer The pitfalls of convergence analysis : is the income gap really widening? Originally published in Applied economics letters, 10
Institute for Public Policy and Economic Analysis. Spatial Income Inequality in the Pacific Northwest, By: Justin R. Bucciferro, Ph.D.
 Institute for Public Policy and Economic Analysis Spatial Income Inequality in the Pacific Northwest, 1970 2010 By: Justin R. Bucciferro, Ph.D. May, 2014 Spatial Income Inequality in the Pacific Northwest,
Role of Political Identity in Friendship Networks
 Role of Political Identity in Friendship Networks Surya Gundavarapu, Matthew A. Lanham Purdue University, Department of Management, 403 W. State Street, West Lafayette, IN 47907 sgundava@purdue.edu; lanhamm@purdue.edu
Non-Voted Ballots and Discrimination in Florida
 Non-Voted Ballots and Discrimination in Florida John R. Lott, Jr. School of Law Yale University 127 Wall Street New Haven, CT 06511 (203) 432-2366 john.lott@yale.edu revised July 15, 2001 * This paper
Economics Marshall High School Mr. Cline Unit One BC
 Economics Marshall High School Mr. Cline Unit One BC Political science The application of game theory to political science is focused in the overlapping areas of fair division, or who is entitled to what,
CS224W Final Project: Super-PAC Donor Networks
 CS224W Final Project: Super-PAC Donor Networks Rush Moody rmoody@stanford.edu December 9, 2015 1 Introduction In a landmark case decided in January of 2010, Citizens United v. Federal Election Commission,
AMONG the vast and diverse collection of videos in
 1 Broadcasting oneself: Visual Discovery of Vlogging Styles Oya Aran, Member, IEEE, Joan-Isaac Biel, and Daniel Gatica-Perez, Member, IEEE Abstract We present a data-driven approach to discover different
Survey Report Victoria Advocate Journalism Credibility Survey The Victoria Advocate Associated Press Managing Editors
 Introduction Survey Report 2009 Victoria Advocate Journalism Credibility Survey The Victoria Advocate Associated Press Managing Editors The Donald W. Reynolds Journalism Institute Center for Advanced Social
Political Participation under Democracy
 Political Participation under Democracy Daniel Justin Kleinschmidt Cpr. Nr.: POL-PST.XB December 19 th, 2012 Political Science, Bsc. Semester 1 International Business & Politics Question: 2 Total Number
Exploring the Impact of Democratic Capital on Prosperity
 Exploring the Impact of Democratic Capital on Prosperity Lisa L. Verdon * SUMMARY Capital accumulation has long been considered one of the driving forces behind economic growth. The idea that democratic
Politcs and Policy Public Policy & Governance Review
 Vol. 3, Iss. 2 Spring 2012 Politcs and Policy Public Policy & Governance Review Party-driven and Citizen-driven Campaigning: The Use of Social Media in the 2008 Canadian and American National Election
Research and strategy for the land community.
 Research and strategy for the land community. To: Northeastern Minnesotans for Wilderness From: Sonia Wang, Spencer Phillips Date: 2/27/2018 Subject: Full results from the review of comments on the proposed
Agent Modeling of Hispanic Population Acculturation and Behavior
 Agent of Hispanic Population Acculturation and Behavior Agent Modeling of Hispanic Population Acculturation and Behavior Lyle Wallis Dr. Mark Paich Decisio Consulting Inc. 201 Linden St. Ste 202 Fort Collins
oductivity Estimates for Alien and Domestic Strawberry Workers and the Number of Farm Workers Required to Harvest the 1988 Strawberry Crop
 oductivity Estimates for Alien and Domestic Strawberry Workers and the Number of Farm Workers Required to Harvest the 1988 Strawberry Crop Special Report 828 April 1988 UPI! Agricultural Experiment Station
Southern Africa Labour and Development Research Unit
 Southern Africa Labour and Development Research Unit Drivers of Inequality in South Africa by Janina Hundenborn, Murray Leibbrandt and Ingrid Woolard SALDRU Working Paper Number 194 NIDS Discussion Paper
Improving the accuracy of outbound tourism statistics with mobile positioning data
 1 (11) Improving the accuracy of outbound tourism statistics with mobile positioning data Survey response rates are declining at an alarming rate globally. Statisticians have traditionally used imputing
Report for the Associated Press: Illinois and Georgia Election Studies in November 2014
 Report for the Associated Press: Illinois and Georgia Election Studies in November 2014 Randall K. Thomas, Frances M. Barlas, Linda McPetrie, Annie Weber, Mansour Fahimi, & Robert Benford GfK Custom Research
FOURIER ANALYSIS OF THE NUMBER OF PUBLIC LAWS David L. Farnsworth, Eisenhower College Michael G. Stratton, GTE Sylvania
 FOURIER ANALYSIS OF THE NUMBER OF PUBLIC LAWS 1789-1976 David L. Farnsworth, Eisenhower College Michael G. Stratton, GTE Sylvania 1. Introduction. In an earlier study (reference hereafter referred to as
Part 1: Focus on Income. Inequality. EMBARGOED until 5/28/14. indicator definitions and Rankings
 Part 1: Focus on Income indicator definitions and Rankings Inequality STATE OF NEW YORK CITY S HOUSING & NEIGHBORHOODS IN 2013 7 Focus on Income Inequality New York City has seen rising levels of income
Supplementary Material for Preventing Civil War: How the potential for international intervention can deter conflict onset.
 Supplementary Material for Preventing Civil War: How the potential for international intervention can deter conflict onset. World Politics, vol. 68, no. 2, April 2016.* David E. Cunningham University of
Explaining differences in access to home computers and the Internet: A comparison of Latino groups to other ethnic and racial groups
 Electron Commerce Res (2007) 7: 265 291 DOI 10.1007/s10660-007-9006-5 Explaining differences in access to home computers and the Internet: A comparison of Latino groups to other ethnic and racial groups